List of cities in Uruguay facts for kids
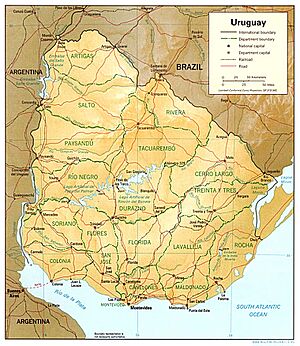
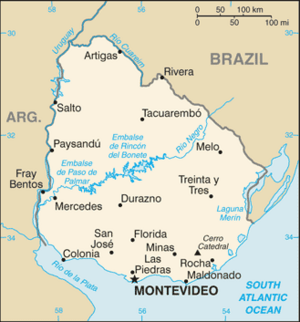
Uruguay is a country in South America, known for its beautiful landscapes and vibrant culture. Like many countries, Uruguay has different types of populated places, and some of them are officially called "cities." This list helps us understand which places have earned that special "city" status. Even some smaller towns can be quite big, but only those officially named "Ciudad" are on this list. The numbers you see for population are just for the city itself, not including any surrounding areas.


What Makes a City?
In Uruguay, a place becomes a "city" (called "Ciudad" in Spanish) through an official decision. This is different from just growing big. Sometimes, a place might have many people but still not be a city. Other times, a smaller place might get city status because it's important for history or its region.
The year next to each city in the list below shows when it officially became a "city." If a place was already a city before Uruguay became independent, or if it was declared a "Villa" (which means "Town") a long time ago, that original date is sometimes shown in parentheses or with an asterisk (*).
Uruguay's Main Cities
Here is a list of the cities in Uruguay, ranked by how many people live there. You can see how their populations changed between the 2004 and 2011 censuses. Each city also belongs to a specific "Department," which is like a state or province in other countries.
| Rank | City | Year | Population 2004 Census |
Population 2011 Census |
Change | Department |
|---|---|---|---|---|---|---|
| 1 | Montevideo | (1724) | 1,269,648 | 1,319,108 | +3.90% | Montevideo |
| 2 | Salto | 1863 | 99,072 | 104,028 | +5.00% | |
| 3 | Ciudad de la Costa | 1994 | 83,399 | 95,176* | +14.12% | |
| 4 | Paysandú | 1863 | 73,272 | 76,412 | +4.29% | |
| 5 | Las Piedras | 1925 | 69,222 | 71,258 | +2.94% | |
| 6 | Rivera | 1912 | 64,426 | 64,465 | +0.06% | |
| 7 | Maldonado | (1755) | 54,603 | 62,590 | +14.63% | |
| 8 | Tacuarembó | 1912 | 51,224 | 54,755 | +6.89% | Tacuarembó |
| 9 | Melo | 1895 | 50,578 | 51,830 | +2.48% | |
| 10 | Mercedes | 1857 | 42,032 | 41,974 | −0.14% | |
| 11 | Artigas | 1915 | 41,687 | 40,658 | −2.47% | |
| 12 | Minas | 1888 | 37,925 | 38,446 | +1.37% | |
| 13 | San José de Mayo | 1856 | 36,339 | 36,743 | +1.11% | |
| 14 | Durazno | 1906 | 33,576 | 34,368 | +2.36% | |
| 15 | Florida | 1894 | 32,128 | 33,639 | +4.70% | |
| 16 | Barros Blancos | 2006 | 13,553 | 31,650 | +133.53% | |
| 17 | Ciudad del Plata | 2006 | 31,145 | NA | ||
| 18 | San Carlos | 1929 | 24,771 | 27,471 | +10.90% | |
| 19 | Colonia del Sacramento | 1809* | 21,714 | 26,213 | +20.72% | |
| 20 | Pando | 1920 | 24,004 | 25,947 | +8.09% | |
| 21 | Treinta y Tres | 1915 | 25,711 | 25,477 | −0.91% | |
| 22 | Rocha | 1894 | 25,538 | 25,422 | −0.45% | |
| 23 | Fray Bentos | 1900 | 23,122 | 22,406 | −3.10% | |
| 24 | Trinidad | 1903 | 20,982 | 21,429 | +2.13% | |
| 25 | La Paz | 1957 | 19,832 | 20,524 | +3.49% | |
| 26 | Canelones | 1916 | 19,631 | 19,865 | +1.19% | |
| 27 | Carmelo | 1920 | 16,866 | 18,041 | +6.97% | |
| 28 | Dolores | 1923 | 15,753 | 17,174 | +9.02% | |
| 29 | Young | 1963 | 15,759 | 16,756 | +6.33% | |
| 30 | Santa Lucía | 1925 | 16,425 | 16,742 | +1.93% | |
| 31 | Progreso | 1981 | 15,775 | 16,244 | +2.97% | |
| 32 | Paso de Carrasco | 1973 | 15,028 | 15,908 | +5.86% | |
| 33 | Río Branco | 1953 | 13,456 | 14,604 | +8.53% | |
| 34 | Paso de los Toros | 1953 | 13,231 | 12,985 | −1.86% | Tacuarembó |
| 35 | Juan Lacaze | 1953 | 13,196 | 12,816 | −2.88% | |
| 36 | Bella Unión | 1963 | 13,187 | 12,200 | −7.48% | |
| 37 | Nueva Helvecia | 1952 | 10,002 | 10,630 | +6.28% | |
| 38 | Libertad | 1963 | 9,196 | 10,166 | +10.55% | |
| 39 | Rosario | 1920 | 9,311 | 10,085 | +8.31% | |
| 40 | Nueva Palmira | 1953 | 9,230 | 9,857 | +6.79% | |
| 41 | Chuy | 1981 | 10,401 | 9,675 | −6.98% | |
| 42 | Punta del Este | 1957 | 7,298 | 9,277 | +27.12% | |
| 43 | Piriápolis | 1960 | 7,899 | 8,830 | +11.79% | |
| 44 | Salinas | 1982 | 6,574 | 8,626 | +31.21% | |
| 45 | Parque del Plata | 1969 | 5,900 | 7,896 | +33.83% | |
| 46 | Lascano | 1952 | 6,994 | 7,645 | +9.31% | |
| 47 | Castillos | 1952 | 7,649 | 7,541 | −1.41% | |
| 48 | Tranqueras | 1994 | 7,284 | 7,235 | −0.67% | |
| 49 | Sarandí del Yí | 1956 | 7,289 | 7,176 | −1.55% | |
| 50 | San Ramón | 1953 | 6,992 | 7,133 | +2.02% | |
| 51 | Tarariras | 1969 | 6,070 | 6,632 | +9.26% | |
| 52 | Pan De Azúcar | 1961 | 7,098 | 6,597 | −7.06% | |
| 53 | Sauce | 1973 | 5,797 | 6,132 | +5.78% | |
| 54 | Sarandí Grande | 1956 | 6,362 | 6,130 | −3.65% | |
| 55 | Atlántida | 1967 | 4,580 | 5,562 | +21.44% | |
| 56 | José Pedro Varela | 1967 | 5,332 | 5,118 | −4.01% | |
| 57 | Tala | 1960 | 4,939 | 5,089 | +3.04% | |
| 58 | Guichón | 1964 | 5,025 | 5,039 | +0.28% | |
| 59 | Cardona | 1963 | 4,689 | 4,600 | −1.90% | |
| 60 | San Jacinto | 1976 | 3,909 | 4,510 | +15.37% | |
| 61 | Toledo | 1995 | 4,028 | 4,397 | +9.16% | |
| 62 | Vergara | 1994 | 3,985 | 3,810 | −4.39% | |
| 63 | Santa Rosa | 1972 | 3,660 | 3,727 | +1.83% | |
| 64 | Florencio Sánchez | 1995 | 3,526 | 3,716 | +5.39% | |
| 65 | La Paloma | 1982 | 3,202 | 3,495 | +9.15% | |
| 66 | San Gregorio de Polanco | 1994 | 3,673 | 3,415 | −7.02% | Tacuarembó |
| 67 | Ombúes de Lavalle | 1984 | 3,451 | 3,390 | −1.77% | |
| 68 | Colonia Valdense | 1982 | 3,087 | 3,235 | +4.79% | |
| 69 | Cerrillos | 1971 | 2,080 | 2,508 | +20.58% | |
| 70 | Aiguá | 1956 | 2,676 | 2,465 | −7.88% | |
| 71 | Migues | 1970 | 2,180 | 2,109 | −3.26% | |
| 72 | San Bautista | 1993 | 1,880 | 1,973 | +4.95% |
* Sometimes, the way populations are counted can be a bit tricky. For example, in the 2011 census, some areas near Ciudad de la Costa were counted with it. This made its population seem larger. However, this list uses the number that matches the official boundaries of the city.
Source: National Institute of Statistics of Uruguay
See also
 In Spanish: Anexo:Ciudades de Uruguay por población para niños
- List of populated places in Uruguay
- Municipalities of Uruguay
 | Georgia Louise Harris Brown |
 | Julian Abele |
 | Norma Merrick Sklarek |
 | William Sidney Pittman |

