
El Dorado County, California facts for kids
Quick facts for kids
El Dorado County
|
|||
|---|---|---|---|
    Images, from top down, left to right: A barn in El Dorado County, the shore of Lake Tahoe in Ed Z'berg Sugar Pine Point State Park, the South Fork American River running through the El Dorado hills, Marshall Gold Discovery State Historic Park
|
|||
|
|||

Location in the state of California
|
|||
| Country | United States | ||
| State | California | ||
| Regions | Northern California, Sierra Nevada, Gold Country | ||
| Metropolitan area | Greater Sacramento | ||
| Incorporated | February 18, 1850 | ||
| Named for | Spanish for "the golden" and El Dorado | ||
| County seat | Placerville | ||
| Largest community | El Dorado Hills | ||
| Government | |||
| • Type | Council–CAO | ||
| • Body |
Board of Supervisors
John Hidahl
George Turnboo Wendy Thomas Lori Parlin Brooke Laine |
||
| Area | |||
| • Total | 1,786 sq mi (4,630 km2) | ||
| • Land | 1,708 sq mi (4,420 km2) | ||
| • Water | 78 sq mi (200 km2) | ||
| Highest elevation | 10,886 ft (3,318 m) | ||
| Population
(2020)
|
|||
| • Total | 191,185 | ||
| • Estimate
(2023)
|
192,215 |
||
| • Density | 107.046/sq mi (41.331/km2) | ||
| GDP | |||
| • Total | $9.877 billion (2022) | ||
| Time zone | UTC−8 (Pacific Time Zone) | ||
| • Summer (DST) | UTC−7 (Pacific Daylight Time) | ||
| ZIP code |
95762
|
||
| Area code | 530, 916, 279 | ||
| FIPS code | 06-017 | ||
| GNIS feature ID | 277273 | ||
| Congressional districts | 3rd, 5th | ||
| Website | www.edcgov.us | ||


El Dorado County is a county in the state of California, USA. Its name comes from a Spanish phrase meaning "The Golden One." This name was chosen because the area became famous for the discovery of gold that started the California Gold Rush.
As of 2020, about 191,185 people live here. The main town and county seat is Placerville. El Dorado County is part of the larger Greater Sacramento area. It stretches from the historic Gold Country foothills in the west to the high Sierra Nevada mountains in the east.
Contents
History of El Dorado County
For many centuries, the land that is now El Dorado County was home to several Native American groups. These included the Maidu, Nisenan, Washoe, and Miwok nations.
The county became very well known in 1848. This was when gold was discovered, leading to the famous California Gold Rush. Because of this important event, the name "El Dorado" was chosen. El Dorado County was one of the first 27 counties created in California on February 18, 1850. Today, California has 58 counties.
The last parts of the Pony Express mail route, which delivered mail by horse, went through El Dorado County. This service ended in 1861 when the telegraph was invented. Today, U.S. Route 50 follows much of that old Pony Express route.
The Placerville Mountain Democrat is California's oldest newspaper that is still being published. It serves the people of El Dorado County.
In August 2021, a large wildfire called the Caldor Fire started in the county. It grew very quickly because of strong winds. The fire caused many people to leave their homes and closed U.S. Route 50. It also came very close to the Lake Tahoe area.
El Dorado County has two main cities: Placerville and South Lake Tahoe.
Geography
El Dorado County covers a total area of about 1,786 square miles (4,626 square kilometers). Most of this area is land, with about 78 square miles (202 square kilometers) being water.
Because it's in the Sierra Nevada mountains, the county has rolling hills and very mountainous areas. The northeastern part of the county is in the Lake Tahoe Basin, which includes a section of the lake itself. The western side of the county, known as the "western slope," makes up most of the area. A part of Folsom Lake is also in the county's northwest corner.
A large portion of the county is public land. The Eldorado National Forest covers about 43% of the county's land. The Lake Tahoe Basin Management Unit also manages land in the eastern part. The Pacific Crest Trail, a famous long-distance hiking trail, runs through the eastern side of the county. The county is also home to the Desolation Wilderness, a popular spot for hiking, backpacking, and fishing.
Neighboring Counties
- Placer County – to the north
- Douglas County, Nevada – to the northeast
- Alpine County – to the southeast
- Amador County – to the south
- Sacramento County – to the southwest
Natural Features
- American River
- Carson Range
- Crystal Range
- Echo Lake
- Fallen Leaf Lake
- Folsom Lake
- Francis Lake
- Freel Peak (the highest point at 10,886 feet)
- Gilmore Lake
- Green Springs Ranch
- Lake Tahoe
- Loon Lake
- Lost Lake
- Mount Price
- Mount Tallac
- Pyramid Lake
- Sierra Nevada
- Silver Peak
- Talking Mountain
- Union Valley Reservoir
- Waca Lake
Fun Things to Do
Historical Places to Visit
- Fountain-Tallman Soda Works
- John Pearson Soda Works
- Combellack-Blair House
- Rubicon Point Light
Parks and Forests
- D. L. Bliss State Park
- Desolation Wilderness
- Eagle Falls trailhead
- Eldorado National Forest
- Emerald Bay State Park
- Folsom Lake State Recreation Area
- Glen Alpine Springs trailhead
- Marshall Gold Discovery State Historic Park
- Pine Hill Ecological Reserve
- Tahoe National Forest
Skiing Spots
Racing Tracks
- Placerville Speedway
Wineries
- California Shenandoah Valley AVA
- El Dorado AVA
- Fair Play AVA
- Sierra Foothills AVA
Population and People
Most of the people in El Dorado County live in a narrow area along U.S. Route 50. The largest community is El Dorado Hills. Other people live near South Lake Tahoe and in smaller towns.
The county's population has grown a lot over the years. In 1850, there were about 20,000 people. By 2020, the population had grown to over 191,000.
| Historical population | |||
|---|---|---|---|
| Census | Pop. | %± | |
| 1850 | 20,057 | — | |
| 1860 | 20,562 | 2.5% | |
| 1870 | 10,309 | −49.9% | |
| 1880 | 10,683 | 3.6% | |
| 1890 | 9,232 | −13.6% | |
| 1900 | 8,986 | −2.7% | |
| 1910 | 7,492 | −16.6% | |
| 1920 | 6,426 | −14.2% | |
| 1930 | 8,325 | 29.6% | |
| 1940 | 13,229 | 58.9% | |
| 1950 | 16,207 | 22.5% | |
| 1960 | 29,390 | 81.3% | |
| 1970 | 43,833 | 49.1% | |
| 1980 | 85,812 | 95.8% | |
| 1990 | 125,955 | 46.8% | |
| 2000 | 156,299 | 24.1% | |
| 2010 | 181,058 | 15.8% | |
| 2020 | 191,185 | 5.6% | |
| 2023 (est.) | 192,215 | 6.2% | |
| U.S. Decennial Census 1790–1960 1900–1990 1990–2000 2010 2020 |
|||
In 2020, most people in El Dorado County were White (about 73%). There were also growing numbers of Asian people (about 4.7%) and people of two or more races (about 5.9%). About 13.8% of the population was Hispanic or Latino.
The average income for a household in the county in 2000 was about $51,484.
Getting Around
Main Roads

 U.S. Route 50
 State Route 49
 State Route 89
 State Route 193
- Luther Pass
Public Transport
- El Dorado Transit offers bus services in Placerville and nearby areas. They also have buses that go to Sacramento and Folsom.
- Tahoe Transportation District runs buses in the South Lake Tahoe area, with some routes going into Nevada.
Airports
Smaller airports for private planes include Placerville Airport, Georgetown Airport, Cameron Park airport, and Lake Tahoe Airport.
Natural Asbestos
Some parts of El Dorado County have natural rock formations that contain a mineral called asbestos. Scientists have studied these areas to understand if these natural asbestos particles could be a health concern. They are working to assess any possible health risks.
Sister City
 Warabi, Japan, became a sister city to El Dorado County on March 26, 1975. This means they have a special friendship and cultural exchange.
Communities

Cities
- Placerville (This is the main town, called the county seat)
- South Lake Tahoe
Census-Designated Places (CDPs)
These are areas that are like towns but are not officially incorporated as cities.
Other Unincorporated Communities
These are smaller communities that are not part of any city or CDP.
- Camp Richardson
- Camp Sacramento
- Cool
- Echo Lake
- El Dorado
- Fair Play
- Garden Valley
- Greenwood
- Happy Valley
- Kyburz
- Omo Ranch
- Outingdale
- Phillips
- Pilot Hill
- Rescue
- Somerset
- Strawberry
- Twin Bridges
Population Ranking of Communities
This table shows the population of the biggest communities in El Dorado County, based on the 2020 census.
† county seat
| Rank | City/town/etc. | Type | Population (2020 Census) |
|---|---|---|---|
| 1 | El Dorado Hills | CDP | 50,547 |
| 2 | South Lake Tahoe | City | 21,330 |
| 3 | Cameron Park | CDP | 18,881 |
| 4 | Diamond Springs | CDP | 11,345 |
| 5 | † Placerville | City | 10,747 |
| 6 | Pollock Pines | CDP | 7,112 |
| 7 | Shingle Springs | CDP | 4,660 |
| 8 | Auburn Lake Trails | CDP | 3,388 |
| 9 | Georgetown | CDP | 2,255 |
| 10 | Camino | CDP | 1,871 |
| 11 | Grizzly Flats | CDP | 1,093 |
| 12 | Tahoma (partially in Placer County) | CDP | 1,034 |
| 13 | Cold Springs | CDP | 556 |
| 14 | Coloma | CDP | 521 |
| 15 | Shingle Springs Rancheria | AIAN | 108 |
Education
El Dorado County has many school districts for students of all ages.
Schools for all grades (K-12)
- Black Oak Mine Unified School District
- Lake Tahoe Unified School District
- Tahoe-Truckee Unified School District
High Schools
- El Dorado Union High School District
Elementary Schools
- Buckeye Union Elementary School District
- Camino Union Elementary School District
- Gold Oak Union Elementary School District
- Gold Trail Union Elementary School District
- Indian Diggings Elementary School District
- Latrobe Elementary School District
- Mother Lode Union Elementary School District
- Pioneer Union Elementary School District
- Placerville Union Elementary School District
- Pollock Pines Elementary School District
- Rescue Union Elementary School District
- Silver Fork Elementary School District
Images for kids
-
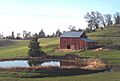
A barn in El Dorado County
-
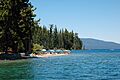
The shore of Lake Tahoe in Ed Z'berg Sugar Pine Point State Park
-
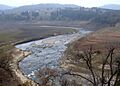
The South Fork American River running through the El Dorado hills
-
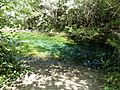
Marshall Gold Discovery State Historic Park
-
Flag of El Dorado County
-
Seal of El Dorado County
-
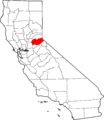
Map of California highlighting El Dorado County
-
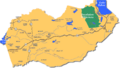
Map of El Dorado County in Northern California
-
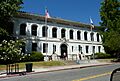
El Dorado County Courthouse in Placerville
See also
 In Spanish: Condado de El Dorado para niños
