Puget Sound region facts for kids
Quick facts for kids
Puget Sound region
|
|
|---|---|
| Country | United States |
| State | Washington |
| Core cities | Seattle Tacoma Bellevue Everett |
| Highest elevation | 14,411 ft (4,392 m) |
| Lowest elevation | 0 ft (0 m) |
| Time zone | UTC−08:00 (Pacific) |
| • Summer (DST) | UTC−07:00 (PDT) |
| Area codes | 206, 253, 360, 425, 564 |
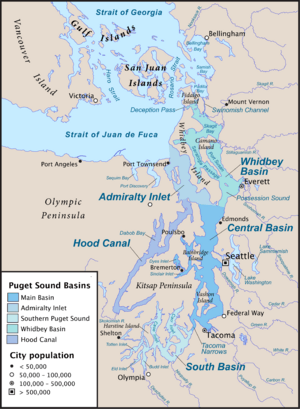
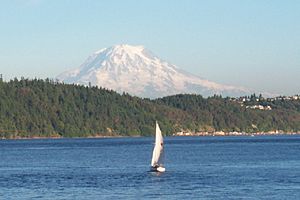
The Puget Sound region is a special coastal area in Washington state, in the Pacific Northwest of the USA. It includes Puget Sound itself, plus the flat lands around it, and the Cascade and Olympic mountains nearby. This area has many saltwater bays, islands, and peninsulas. These shapes were all carved out by huge glaciers long ago.
A poet named Robert Sund called this area "Ish River country." This is because many rivers here have names ending in "ish," like the Duwamish and Snohomish. The word "ish" comes from the Salishan languages spoken by Native American tribes, and it means "people of."
Contents
How Was Puget Sound Formed?
The Puget Sound region was created by huge pieces of land, called terranes or "microcontinents," crashing into and joining the North American Plate. This happened between 50 and 10 million years ago.
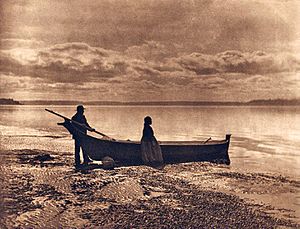
About 15,000 years ago, during a time called the Vashon Glaciation, a giant sheet of ice covered the Puget Sound area. This glacier was about 3,000 feet (910 meters) thick near what is now Seattle. Long before European explorers arrived, Native American people had already lived in this region for over 5,000 years.
Early Exploration and Settlement
In 1792, Captain George Vancouver explored Puget Sound. He claimed the area for Great Britain and named it after one of his officers, Lieutenant Peter Puget. Later, this land became part of the Oregon Country. It became U.S. territory in 1846 after the Oregon Treaty was signed.
Many settlers traveled west on the Oregon Trail. Some of them moved north to what is now Washington state. They started the first non-Native American settlement in 1846, called New Market (now Tumwater). In 1853, Washington Territory was created from part of the Oregon Territory.
Growth and Industry
Logging, which is cutting down trees for wood, began in the Puget Sound region as early as 1853. By the 1880s, logging railroads were built to help move the timber. In 1888, the Northern Pacific railroad line reached Puget Sound. This connected the region to the eastern parts of the United States.
For a long time, Tacoma was known for its large smelters. These factories processed ores like gold, silver, copper, and lead. Seattle became a major port for trade with Alaska and other parts of the country. For a while, it also had a large shipbuilding industry.
During World War I and World War II, the eastern Puget Sound area became a center for heavy industry. The Boeing Company grew very important here, producing many heavy bomber airplanes during World War II. Shipyards in Seattle, Bremerton, and Tacoma also built many ships for the war. They produced a large number of destroyers and escort carriers.
Since 1995, the Puget Sound region has also been recognized for its wine production. It is called an American Viticultural Area.
What is the Political Geography of Puget Sound?
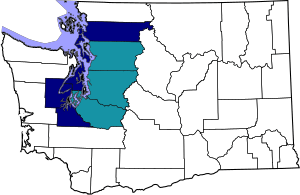
The urban area known as the Puget Sound Region is centered around Seattle. It includes nine counties and several major cities. People sometimes call this urban area "Pugetopolis."
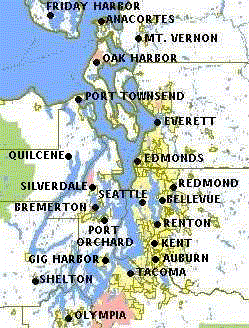
The two main cities, Seattle and Tacoma, have large industrial areas and seaports. They also have tall buildings in their downtown areas. Other cities, called satellite cities, are mostly suburban. They have smaller downtowns and industrial areas. The suburbs are mainly homes, shopping centers, and stores.
The region has many ports. The two biggest and busiest are the Port of Seattle and Port of Tacoma. If you combine them, they form the third largest container port in North America.
The U.S. Census Bureau defines the Seattle metropolitan area as the Seattle–Tacoma–Bellevue, WA metropolitan statistical area (MSA). This area includes:
- Snohomish County: located north of Seattle.
- King County: where Seattle and its nearby areas are located.
- Pierce County: located south of Seattle.
A larger area, called the Seattle–Tacoma combined statistical area (CSA), includes more places. This wider region has a population of over 4.2 million people. This is almost two-thirds of Washington's total population. This larger area includes:
- Kitsap County: west of Seattle, connected by ferries and the Tacoma Narrows Bridge.
- Lewis County: south of Olympia.
- Skagit County.
- Island County: northwest of Everett, including Whidbey and Camano Islands.
- Thurston County: southwest of Seattle, at the south end of Puget Sound.
- Mason County: west of Tacoma and northwest of Olympia.
The Washington State Ferries system helps connect the larger islands to the mainland. It also links both sides of Puget Sound, making it easier for people and cars to travel around the region.
Climate
| Climate data for Seattle (SeaTac Airport), 1981–2010 normals, extremes 1894–present | |||||||||||||
|---|---|---|---|---|---|---|---|---|---|---|---|---|---|
| Month | Jan | Feb | Mar | Apr | May | Jun | Jul | Aug | Sep | Oct | Nov | Dec | Year |
| Record high °F (°C) | 67 (19) |
70 (21) |
78 (26) |
89 (32) |
93 (34) |
98 (37) |
103 (39) |
99 (37) |
98 (37) |
89 (32) |
74 (23) |
66 (19) |
103 (39) |
| Mean maximum °F (°C) | 56.4 (13.6) |
60.3 (15.7) |
66.0 (18.9) |
74.7 (23.7) |
81.5 (27.5) |
85.5 (29.7) |
90.6 (32.6) |
88.8 (31.6) |
84.6 (29.2) |
72.2 (22.3) |
60.7 (15.9) |
55.9 (13.3) |
93.8 (34.3) |
| Mean daily maximum °F (°C) | 47.2 (8.4) |
49.9 (9.9) |
53.7 (12.1) |
58.5 (14.7) |
64.7 (18.2) |
69.9 (21.1) |
75.8 (24.3) |
76.3 (24.6) |
70.5 (21.4) |
59.7 (15.4) |
50.9 (10.5) |
45.7 (7.6) |
60.3 (15.7) |
| Daily mean °F (°C) | 42.0 (5.6) |
43.4 (6.3) |
46.5 (8.1) |
50.3 (10.2) |
56.0 (13.3) |
60.9 (16.1) |
65.7 (18.7) |
66.1 (18.9) |
61.3 (16.3) |
52.8 (11.6) |
45.4 (7.4) |
40.6 (4.8) |
52.6 (11.4) |
| Mean daily minimum °F (°C) | 36.9 (2.7) |
36.9 (2.7) |
39.3 (4.1) |
42.2 (5.7) |
47.3 (8.5) |
51.9 (11.1) |
55.6 (13.1) |
55.9 (13.3) |
52.1 (11.2) |
45.8 (7.7) |
40.0 (4.4) |
35.6 (2.0) |
45.0 (7.2) |
| Mean minimum °F (°C) | 25.4 (−3.7) |
25.9 (−3.4) |
31.3 (−0.4) |
35.0 (1.7) |
39.7 (4.3) |
46.2 (7.9) |
50.6 (10.3) |
50.7 (10.4) |
44.6 (7.0) |
35.7 (2.1) |
28.7 (−1.8) |
24.0 (−4.4) |
19.5 (−6.9) |
| Record low °F (°C) | 0 (−18) |
1 (−17) |
11 (−12) |
29 (−2) |
28 (−2) |
38 (3) |
43 (6) |
44 (7) |
35 (2) |
28 (−2) |
6 (−14) |
6 (−14) |
0 (−18) |
| Average precipitation inches (mm) | 5.57 (141) |
3.50 (89) |
3.72 (94) |
2.71 (69) |
1.94 (49) |
1.57 (40) |
0.70 (18) |
0.88 (22) |
1.50 (38) |
3.48 (88) |
6.57 (167) |
5.35 (136) |
37.49 (952) |
| Average snowfall inches (cm) | 1.4 (3.6) |
1.7 (4.3) |
0.8 (2.0) |
0 (0) |
0 (0) |
0 (0) |
0 (0) |
0 (0) |
0 (0) |
0 (0) |
1.2 (3.0) |
1.7 (4.3) |
6.8 (17) |
| Average precipitation days (≥ 0.01 in) | 18.2 | 14.7 | 16.9 | 14.3 | 12.0 | 9.1 | 5.0 | 4.8 | 7.9 | 13.1 | 18.4 | 17.6 | 152.0 |
| Average snowy days (≥ 0.1 in) | 1.3 | 0.9 | 0.5 | 0 | 0 | 0 | 0 | 0 | 0 | 0 | 0.3 | 1.6 | 4.6 |
| Average relative humidity (%) | 78.0 | 75.2 | 73.6 | 71.4 | 68.9 | 67.1 | 65.4 | 68.2 | 73.2 | 78.6 | 79.8 | 80.1 | 73.3 |
| Mean monthly sunshine hours | 69.8 | 108.8 | 178.4 | 207.3 | 253.7 | 268.4 | 312.0 | 281.4 | 221.7 | 142.6 | 72.7 | 52.9 | 2,169.7 |
| Percent possible sunshine | 25 | 38 | 48 | 51 | 54 | 56 | 65 | 64 | 59 | 42 | 26 | 20 | 49 |
| Source: NOAA (relative humidity and sun 1961–1990) | |||||||||||||
| Climate data for Olympia Regional Airport, Washington (1981–2010 normals, extremes 1948–present) | |||||||||||||
|---|---|---|---|---|---|---|---|---|---|---|---|---|---|
| Month | Jan | Feb | Mar | Apr | May | Jun | Jul | Aug | Sep | Oct | Nov | Dec | Year |
| Record high °F (°C) | 64 (18) |
73 (23) |
79 (26) |
88 (31) |
96 (36) |
98 (37) |
104 (40) |
104 (40) |
98 (37) |
90 (32) |
74 (23) |
64 (18) |
104 (40) |
| Mean maximum °F (°C) | 56.2 (13.4) |
60.6 (15.9) |
67.5 (19.7) |
77.0 (25.0) |
83.8 (28.8) |
88.0 (31.1) |
93.4 (34.1) |
91.9 (33.3) |
86.8 (30.4) |
74.0 (23.3) |
61.0 (16.1) |
55.0 (12.8) |
96.3 (35.7) |
| Mean daily maximum °F (°C) | 45.9 (7.7) |
49.3 (9.6) |
53.9 (12.2) |
58.9 (14.9) |
65.3 (18.5) |
70.6 (21.4) |
76.8 (24.9) |
77.7 (25.4) |
71.8 (22.1) |
60.2 (15.7) |
50.2 (10.1) |
44.2 (6.8) |
60.4 (15.8) |
| Mean daily minimum °F (°C) | 33.7 (0.9) |
32.8 (0.4) |
35.1 (1.7) |
37.7 (3.2) |
43.1 (6.2) |
47.6 (8.7) |
50.8 (10.4) |
50.5 (10.3) |
46.0 (7.8) |
40.5 (4.7) |
36.4 (2.4) |
32.6 (0.3) |
40.6 (4.8) |
| Mean minimum °F (°C) | 18.8 (−7.3) |
18.6 (−7.4) |
23.8 (−4.6) |
27.3 (−2.6) |
32.1 (0.1) |
38.2 (3.4) |
42.2 (5.7) |
41.1 (5.1) |
35.1 (1.7) |
27.3 (−2.6) |
21.6 (−5.8) |
16.8 (−8.4) |
11.1 (−11.6) |
| Record low °F (°C) | −8 (−22) |
−1 (−18) |
9 (−13) |
23 (−5) |
25 (−4) |
30 (−1) |
35 (2) |
33 (1) |
25 (−4) |
14 (−10) |
−1 (−18) |
−7 (−22) |
−8 (−22) |
| Average precipitation inches (mm) | 7.84 (199) |
5.27 (134) |
5.29 (134) |
3.54 (90) |
2.33 (59) |
1.76 (45) |
0.63 (16) |
0.94 (24) |
1.71 (43) |
4.60 (117) |
8.63 (219) |
7.46 (189) |
50.00 (1,270) |
| Average snowfall inches (cm) | 1.9 (4.8) |
4.7 (12) |
0.7 (1.8) |
trace | 0 (0) |
0 (0) |
0 (0) |
0 (0) |
0 (0) |
0 (0) |
0.9 (2.3) |
2.6 (6.6) |
10.8 (27) |
| Average precipitation days (≥ 0.01 in) | 20.0 | 15.8 | 18.5 | 15.7 | 12.5 | 9.1 | 4.6 | 4.9 | 7.8 | 14.2 | 20.1 | 19.6 | 162.8 |
| Average snowy days (≥ 0.1 in) | 1.1 | 2.2 | 0.3 | 0.2 | 0 | 0 | 0 | 0 | 0 | 0 | 0.5 | 2.0 | 6.3 |
| Average relative humidity (%) | 87.5 | 84.5 | 80.0 | 75.6 | 72.9 | 72.4 | 70.8 | 72.1 | 77.6 | 85.1 | 88.4 | 89.1 | 79.7 |
| Source: NOAA (relative humidity 1961–1990) | |||||||||||||
Flora and Fauna
One of the main types of plant life in the Puget Sound area is the North Pacific Oak Woodland. This is because many of the soils here drain well and have a good amount of moisture.
Important Places in the Puget Sound Region
Here are some of the counties that make up the Puget Sound region:
- Island County
- Jefferson County
- King County
- Kitsap County
- Mason County
- Pierce County
- Skagit County
- Snohomish County
- Thurston County
The San Juan Islands are also often considered part of the greater Puget Sound area.
Prominent Islands
- Anderson Island
- Bainbridge Island
- Blake Island
- Camano Island
- Fidalgo Island
- Fox Island
- Harstine Island
- Herron Island
- Indian Island
- Marrowstone Island
- Maury Island
- McNeil Island
- Mercer Island
- Squaxin Island
- Vashon Island
- Whidbey Island
Major Cities
Other Important Cities
- Auburn
- Edmonds
- Federal Way
- Kent
- Kirkland
- Lakewood
- Lynnwood
- Marysville
- Mount Vernon
- Oak Harbor
- Puyallup
- Redmond
- Renton
- Shoreline
Military Bases
- Joint Base Lewis–McChord
- Camp Murray
- Naval Station Everett
- Naval Base Kitsap
- Bangor Annex
- Bremerton Annex
- Puget Sound Naval Shipyard
- Naval Air Station Whidbey Island
See also
- Puget Sound
- Puget Sound AVA (American Viticultural Area)
- Seattle metropolitan area
- Peter Puget
 | Leon Lynch |
 | Milton P. Webster |
 | Ferdinand Smith |


