Genetic history of Indigenous peoples of the Americas facts for kids
The genetic history of Indigenous peoples of the Americas is like a huge family tree. It tells us how people first arrived and spread across North and South America. Scientists divide this history into two main parts. The first part is about the initial journey of people to the Americas, which happened about 20,000 to 14,000 years ago. The second part is about what happened after Europeans arrived, starting around 500 years ago.
Most Indigenous American groups come from two ancient family lines. These lines formed in Siberia a long, long time ago, between 36,000 and 25,000 years ago. They are called East Eurasian and Ancient North Eurasian. These groups then spread throughout the Americas after about 16,000 years ago. Some groups, like those who speak Na-Dene and Eskimo–Aleut languages, came from Siberian populations that arrived later.
In the early 2000s, scientists mainly studied human Y-chromosome DNA haplogroups and human mitochondrial DNA haplogroups. These are special markers in our DNA that pass down through fathers (Y-DNA) or mothers (mtDNA). Scientists also use other DNA markers called "autosomal DNA" (atDNA). These help them understand how different groups are related.
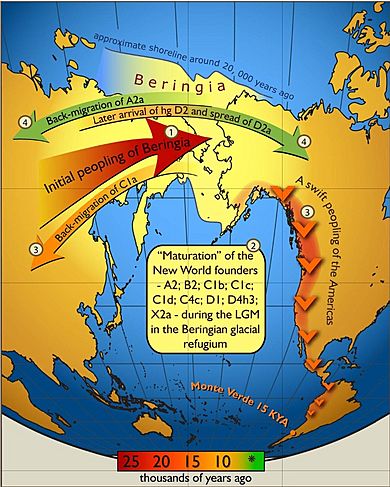
Studies of genetics in Indigenous American and Siberian populations suggest that the first groups were isolated on a land bridge called Beringia. Then, they quickly moved from Siberia into the Americas. DNA from South America shows that some groups have been isolated since the very first people arrived there. Groups like the Na-Dené, Inuit, and Indigenous Alaskan populations have a specific Y-DNA marker called Haplogroup Q-M242. However, they are different from other Indigenous Americans in other DNA markers. This suggests that the people who first settled in northern North America and Greenland came from later groups of migrants. Scientists who study languages and biologists who study blood types have reached similar conclusions.
Contents
Autosomal DNA: Our Genetic Map
Scientists use autosomal DNA (atDNA) to study genetic diversity. They take samples from North, Central, and South America. Then, they compare them to DNA from other indigenous populations around the world.
Indigenous American populations show less genetic diversity than people from other continents. This diversity decreases the farther away you get from the Bering Strait. The Bering Strait was like the entry point from Siberia. This means that the first people who came to the Americas spread out from that area.
Scientists also found more diversity in western South America compared to eastern South America. There isn't much difference between people in Mesoamerica and the Andes. This suggests that early people found it easier to travel along the Pacific coast than through inland routes.
The overall picture shows that a small number of people (about 70) first settled the Americas. This group then grew much larger over 800 to 1000 years. The DNA also shows that there has been some genetic mixing between Asia, the Arctic, and Greenland since the first people arrived.
A 2012 study found that Native Americans came from at least three main groups from East Asia. Most of their ancestry comes from a single group called 'First Americans'. However, Inuit speakers from the Arctic got almost half of their ancestry from a second East Asian group. And Na-dene speakers got a tenth of their ancestry from a third group. After the first settlement, people quickly spread south along the west coast. There was little mixing of genes later, especially in South America. One exception is the Chibcha speakers of Colombia, whose ancestry comes from both North and South America.
In 2014, scientists studied the DNA of a 12,500-year-old baby found in Montana. This baby, called Anzick-1, was found with ancient tools. The DNA showed strong links to Siberian sites. It also showed strong links to all existing Indigenous American populations. This means that all these groups came from an ancient population that lived in or near Siberia.
Language studies have also supported genetic studies. They found old connections between languages spoken in Siberia and those in the Americas.
Two studies in 2015 confirmed that the first people in the Americas came from Siberia. However, they also found a small genetic link to people from Australasia (Australia, Melanesia, and the Andaman Islands) among people in the Amazon basin. This migration from Siberia likely happened 23,000 years ago.
A 2018 study looked at 11,500-year-old Indigenous samples. The genetic evidence suggests that all Native Americans came from one founding group. This group split from a larger East Asian group in Southeast Asia about 36,000 years ago. This was around the same time the Jōmon people of Japan also split from East Asians. The study also showed that the main northern and southern Native American groups split about 16,000 years ago. An Indigenous American sample from 16,000 BC in Idaho was mostly East-Eurasian genetically. It was very similar to modern East Asians and Jōmon people from Japan. This confirms that the ancestors of Native Americans came from an East-Eurasian group in eastern Siberia.
Another study in 2018 said that Native Americans came from a single founding group. This group split from East Asians around 36,000 BC. There was still some gene flow between these ancestors and Siberians until about 25,000 BC. Then, they became isolated in the Americas around 22,000 BC. Northern and Southern American groups split from each other around 17,500 BC. There's also some evidence that people moved back from the Americas to Siberia after 11,500 BC.
A 2019 study looked at 49 ancient Native American samples from all over North and South America. It concluded that all Native American populations came from one single ancestral group. This group split from Siberians and East Asians. Then, it gave rise to the Ancestral Native Americans, who later formed the different indigenous groups. The study also said that there was no evidence of two different groups settling the Americas. Both Northern and Southern Native Americans are closely related.
A 2021 review article confirmed that all Native Americans came from people who moved from Northeast Asia into the Americas. Once south of the ice sheets, these Ancestral Americans spread quickly. They branched into many groups, which later became the major Native American populations. The study also said there was no evidence of a separate non-Native American group (like those related to Indigenous Australians). They explained that earlier claims were based on a misunderstood genetic signal. This signal actually showed early East-Eurasian gene flow into Aboriginal Australians and Papuans.
Paternal Lineages: Tracing Father's Side
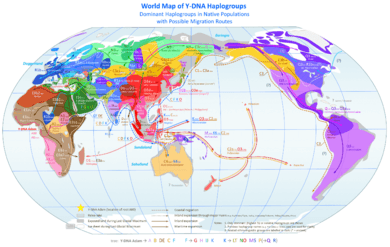
Scientists believe that the male ancestors of the first people to migrate to the Americas came from "Central Siberia."
If someone has Q and C3b in their Y-DNA, it means their father's side of the family is Indigenous American.
The Y-DNA of some groups in South America shows they became isolated after the first people settled there. The Na-Dené, Inuit, and Indigenous Alaskan populations have a specific Y-DNA marker called haplogroup Q (Y-DNA). But they are different from other Indigenous Americans in other DNA markers. This suggests that the first people to move into northern North America and Greenland came from later groups of migrants.
Haplogroup Q
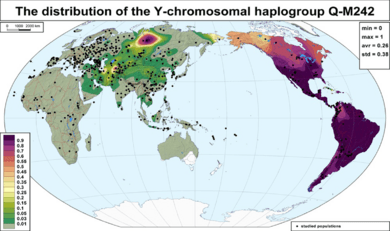
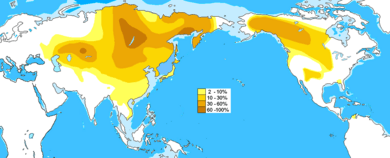
Q-M242 is a key Y-DNA marker. In Eurasia, it's found in Siberian populations like the Chukchi and Koryak peoples. It's also in some Southeast Asians. Two groups, the Ket (93.8%) and the Selkup (66.4%), have a lot of Q-M242. The Ket are thought to be survivors of ancient wanderers in Siberia.
During the Paleo-Indian period, a small group carrying the Q-M242 marker crossed the Bering Strait (Beringia) into the Americas. A new mutation happened in this group, creating a new marker called Q-M3. People with Q-M3 then spread all over the Americas.
Q-M3 is about 15,000 years old. This is when the first Paleo-Indians migrated to the Americas. Q-M3 is the most common Y-DNA marker in the Americas. It's found in 83% of South American populations, 50% of Na-Dené populations, and 46% of North American Eskimo-Aleut populations. Since Q-M3 is rarely found in Eurasia, it likely developed in eastern Beringia or western Alaska. The Beringia land bridge later disappeared under water, cutting off land routes.
Since Q-M3 was discovered, scientists have found several subgroups. For example, in South America, some groups have a lot of Q-M19. This marker is found in 59% of Amazonian Ticuna men and 10% of Wayuu men. Q-M19 seems to be unique to South American Indigenous people. It appeared 5,000 to 10,000 years ago. This suggests that groups started to become isolated soon after moving into South America. Other American subgroups include Q-L54 and Q-M346. In Canada, Q-P89.1 and Q-NWT01 have been found.
Haplogroup R1
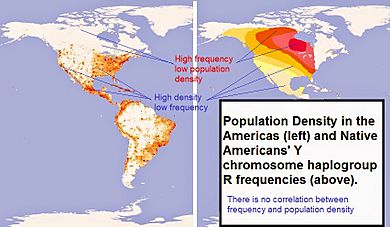
Haplogroup R1 (Y-DNA) is the second most common Y-DNA marker among Indigenous Americans, after Q. Some believe its spread is linked to people moving back into Eurasia after the last ice age. R1 is very common across Eurasia, except in East and Southeast Asia. R1 (M173) is mostly found in North American groups. For example, it's in 50-79% of Ojibwe people, 50% of Seminole, 50% of Sioux, 47% of Cherokee, 40% of Dogrib, and 38% of Tohono O'odham.
A 2014 study found that the DNA of an ancient Siberian child (Mal'ta boy-1) had R* y-DNA. This DNA was similar to modern Western Eurasians and closely related to modern Indigenous Americans. It was not closely related to East Asians. This suggests that populations related to Western Eurasians lived further northeast 24,000 years ago than previously thought. Another Siberian sample (Afontova Gora-2) showed that Western Eurasian genes in modern Indigenous Americans don't just come from mixing after Columbus arrived. They also come from the mixed ancestry of the first Americans. Scientists think that the Mal'ta boy might be a "missing link." He could represent an Asian population that mixed with both Europeans and Native Americans.
Haplogroup C-P39
Haplogroup C-M217 is mostly found in indigenous Siberians, Mongolians, and Kazakhs. It's the most common branch of the larger C-M130 group. A descendant of C-M217, called C-P39, is most common in today's Na-Dené speakers. It's found in 42% of Athabaskans and less often in some other Native American groups. This unique branch, C-P39, includes almost all the C-M217 Y-chromosomes found among Indigenous peoples of the Americas.
Some researchers think this means the Na-Dené migration happened from the Russian Far East. This would have been after the first Paleo-Indian settlement, but before modern Inuit, Inupiat, and Yupik groups spread.
Besides Na-Dené peoples, haplogroup C-P39 (C2b1a1a) is also found among other Native Americans. These include Algonquian and Siouan speaking groups. C-M217 is also found among the Wayuu people of Colombia and Venezuela.
Paternal Lineage Data
Here is a table showing the Y-DNA haplogroups of some Indigenous peoples of the Americas. The percentages show how common each haplogroup is in that group.
| Group | Language | Place | n | C | Q | R1 | Others | Reference |
|---|---|---|---|---|---|---|---|---|
| Algonquian | Algic | Northeast North America | 155 | 7.7 | 33.5 | 38.1 | 20.6 | Bolnick 2006 |
| Apache | Na-Dené | SW United States | 96 | 14.6 | 78.1 | 5.2 | 2.1 | Zegura 2004 |
| Athabaskan | Na-Dené | Western North America | 243 | 11.5 | 70.4 | 18.1 | Malhi 2008 | |
| Cherokee | Iroquoian | SE United States | 62 | 1.6 | 50.0 | 37.1 | 11.3 | Bolnick 2006 |
| Cherokee | Iroquoian | Eastern North America | 30 | 50.0 | 46.7 | 3.3 | Malhi 2008 | |
| Cheyenne | Algic | United States | 44 | 16 | 61 | 16 | 7 | Zegura 2004 |
| Chibchan | Macro-Chibchan | Panama | 26 | 100 | Zegura 2004 | |||
| Chipewyan | Na-Dené | Canada | 48 | 6 | 31 | 62.5 | Bortoloni 2003 | |
| Chippewa | Algic | Eastern North America | 97 | 4.1 | 15.9 | 50.5 | 29.9 | Bolnick 2006 |
| Dogrib | Na-Dené | Canada | 15 | 33 | 27 | 40 | Malhi 2008 | |
| Dogrib | Na-Dené | Canada | 37 | 35.1 | 45.9 | 8.1 | 10.8 | Dulik 2012 |
|
Gê |
Macro-Jê | Brazil | 51 | 92 | 8 | Bortoloni 2003 | ||
| Guaraní | Tupian | Paraguay | 59 | 86 | 9 | 5 | Bortoloni 2003 | |
| Inga | Quechua | Colombia | 11 | 78 | 11 | 11 | Bortoloni 2003 | |
| Inuit | Eskimo–Aleut | North American Arctic | 60 | 80.0 | 11.7 | 8.3 | Zegura 2004 | |
| Inuvialuit | Eskimo–Aleut | Canada | 56 | 1.8 | 55.1 | 33.9 | 8.9 | Dulik 2012 |
| Mayan | Mesoamerica | 71 | 87.3 | 12.7 | Zegura 2004 | |||
| Mixe | Mixe–Zoque | Mexico | 12 | 100 | Zegura 2004 | |||
| Mixtec | Oto-Manguean | Mexico | 28 | 93 | 7 | Zegura 2004 | ||
| Muskogean | Muskogean | SE United States | 36 | 2.8 | 75 | 11.1 | 11.1 | Bolnick 2006 |
| Nahua | Uto-Aztecan | Mexico | 17 | 94 | 6 | Malhi 2008 | ||
| Native Americans (United States) |
United States | 398 | 9.0 | 58.1 | 22.2 | 10.7 | Hammer 2005 | |
| Navajo | Na-Dené | SW United States | 78 | 1.3 | 92.3 | 2.6 | 3.8 | Zegura 2004 |
| Native North Americans | North America | 530 | 6.0 | 77.2 | 12.5 | 4.3 | Zegura 2004 | |
| Papago | Uto-Aztecan | SW United States | 13 | 61.5 | 38.5 | Malhi 2008 | ||
| Seminole | Muskogean | Eastern North America | 20 | 45.0 | 50.0 | 5.0 | Malhi 2008 | |
| Sioux | Macro-Siouan | Central North America | 44 | 11 | 25 | 50 | 14 | Zegura 2004 |
| South America | Amerindian | South America | 390 | 92 | 4 | 4 | Bortoloni 2003 | |
| Tanana | Na-Dené | Northwest North America | 12 | 42 | 42 | 8 | 8 | Zegura 2004 |
| Ticuna | Ticuna–Yuri | West Amazon basin | 33 | 100 | Bortoloni 2003 | |||
| Tlingit | Na-Dené | Pacific Northwest | 11 | 18 | 82 | Dulik 2012 | ||
| Tupí–Guaraní | Tupian | Brazil | 54 | 100 | Bortoloni 2003 | |||
| Uto-Aztecan | Uto-Aztecan | Mexico, Arizona | 167 | 93.4 | 6.0 | Malhi 2008 | ||
| Warao | Warao (isolate) | Caribbean South America | 12 | 100 | Bortoloni 2003 | |||
| Wayúu | Arawakan | Guajira Peninsula | 19 | 69 | 21 | 10 | Bortoloni 2003 | |
| Wayúu | Arawakan | Guajira Peninsula | 25 | 8 | 36 | 44 | 12 | Zegura 2004 |
| Yagua | Peba–Yaguan | Peru | 7 | 100 | Bortoloni 2003 | |||
| Yukpa | Cariban | Colombia | 12 | 100 | Bortoloni 2003 | |||
| Zapotec | Oto-Manguean | Mexico | 16 | 75 | 6 | 19 | Zegura 2004 | |
| Zenú | extinct | Colombia | 30 | 81 | 19 | Bortoloni 2003 |
Maternal Lineages: Tracing Mother's Side
Scientists have long known that certain mtDNA haplogroups (A, B, C, D, and X) are common in both East Asian and Indigenous American populations. The highest number of these four haplogroups is found in the Altai-Baikal region of southern Siberia. Some subgroups of C and D that are similar to Indigenous American ones are found in Mongolian, Amur, Japanese, Korean, and Ainu populations.
Studies of human mitochondrial DNA (mtDNA) show that Indigenous American haplogroups, including haplogroup X, came from a single founding East Asian population. This also suggests that the way mtDNA haplogroups are spread, and how different they are among similar language groups, came from many migrations from the Bering Strait area.
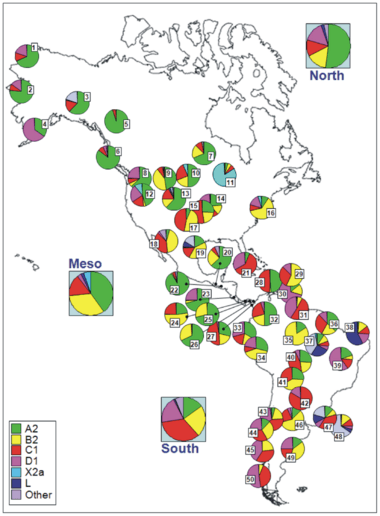
All Indigenous American mtDNA can be traced back to five main haplogroups: A, B, C, D, and X. More specifically, they belong to subgroups A2, B2, C1b, C1c, C1d, D1, and X2a (with smaller groups C4c, D2a, and D4h3a). This means that 95% of Indigenous American mtDNA comes from a very small group of founding women. The other 5% comes from the X2a, D2a, C4c, and D4h3a subgroups.
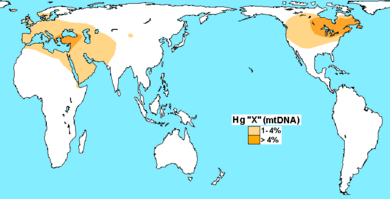
Haplogroup X is one of the five mtDNA haplogroups found in Indigenous American peoples. Unlike the other four, X is not strongly linked to East Asia. Haplogroup X split into two subgroups, X1 and X2, about 20,000 to 30,000 years ago. X2's subgroup, X2a, is found in only about 3% of the total current Indigenous population of the Americas. However, X2a is a major mtDNA subgroup in North America. Among the Algonquian peoples, it makes up to 25% of mtDNA types. It's also found in smaller percentages to the west and south, such as among the Sioux (15%), the Nuu-chah-nulth (11%–13%), the Navajo (7%), and the Yakama (5%). Haplogroup X is more common in the Near East, the Caucasus, and Mediterranean Europe. The main idea for X2a's presence in North America is that it migrated along with the A, B, C, and D mtDNA groups from the Altai Mountains in central Asia. Haplotype X6 was found in the Tarahumara (1.8%) and Huichol (20%) peoples.
DNA from Paleo-Eskimo remains (3,500 years old) is different from modern Indigenous Americans. It falls into subgroup D2a1, which is found in today's Aleutian Islanders, the Aleut, and Siberian Yupik populations. This suggests that the people who settled the far north, and later Greenland, came from later coastal groups. Then, about 800–1,000 years ago, the Thule people (proto-Inuit) brought new genes to the existing Paleo-Eskimo populations in Canada and Greenland. This led to the modern Inuit.
A 2013 study found DNA in the 24,000-year-old remains of a boy from the Mal'ta-Buret' culture. This DNA suggests that up to one-third of Indigenous Americans' ancestry comes from western Eurasians. These Eurasians may have lived further northeast 24,000 years ago than thought. Professor Kelly Graf said this shows that ancient Siberians came from a diverse group of early modern humans. These humans spread from Africa to Europe and Central and South Asia. She also said that ancient skeletons like Buhl Woman can be linked directly to ancient Siberia.
A route through Beringia is seen as more likely than the Solutrean hypothesis (which suggested a European origin). A 2012 study said that similarities in ages and locations for C4c and X2a mtDNA lines support two origins for early Americans. Since C4c is clearly from Asia, finding that C4c and X2a have similar genetic histories rules out the idea of an Atlantic route into North America.
Another study on mtDNA showed that the maternal ancestry of Indigenous peoples of the Americas comes from a few founding lines from East Asia. These lines arrived via the Bering Strait. This study suggests that the ancestors of Native Americans might have stayed in the Bering Strait region for some time. After that, they quickly moved to settle the Americas, taking their founding genetic lines all the way to South America.
A 2016 study on mtDNA lines suggested that a small group entered the Americas along the coast around 16,000 years ago. This group had been isolated in eastern Beringia for about 2,400 to 9,000 years after separating from East Siberian populations. After quickly spreading across the Americas, there was limited gene flow in South America. This led to distinct population structures that lasted over time. All the ancient mtDNA lines found in this study were missing from modern data. This suggests that many lines died out. The study also found that European colonization caused a big loss of pre-Columbian genetic lines.
Genetic Mixing and Ancient Groups
Ancient Beringians
New discoveries in Alaska have shown there was a previously unknown Indigenous American group called "Ancient Beringians." Scientists generally agree that early settlers crossed into Alaska from Russia using the Bering Strait land bridge. However, there's a debate about whether there was one founding group or several waves of migration.
In 2018, scientists sequenced the DNA of a native girl found in Alaska. Her DNA didn't match the two known branches of Native Americans. Instead, it belonged to the Ancient Beringians. This was the first direct genetic proof that there might have been only one migration wave into the Americas. Genetic branching and division happened later. This migration wave is thought to have happened about 20,000 years ago. The Ancient Beringians are believed to be a common ancestor for today's Native American populations. This is different from earlier research that suggested modern populations came from Northern and Southern branches. Experts also used wider genetic evidence to show that the split between the Northern and Southern American groups from the Ancient Beringians happened only about 17,000 and 14,000 years ago. This further challenges the idea of multiple migration waves at the very beginning of settlement.
Genetic evidence for "Paleoamerinds" includes signs of ancient mixing in remote populations in the South American rainforest and in the genetics of Patagonians-Fuegians.
Nomatto et al. (2009) suggested that migration into Beringia happened between 40,000 and 30,000 years ago. Then, people moved into the Americas before the Last Glacial Maximum. After that, the northern population became isolated when the ice-free corridor closed.
A 2016 genetic study of native peoples in the Amazon region of Brazil found evidence of mixing from a separate, unknown ancient group. This ancient group seems to be related to modern "Australasian" peoples (like Aboriginal Australians and Melanesians). This "Ghost population" was found in speakers of Tupian languages. They called this ancient group "Population Y," after Ypykuéra, which means 'ancestor' in the Tupi language family. However, a 2021 genetic study said there was no Australasian part in Native Americans. The signal that looked like Australasian ancestry could also be explained by the Basal-East Asian Tianyuan man sample. This means it doesn't represent "real Australasian affinity." The authors explained that earlier claims were based on a misunderstood genetic signal. This signal actually showed early East-Eurasian gene flow (like the 40,000-year-old Tianyuan sample) into Aboriginal Australians and Papuans, which was lost in modern East Asians.
Archaeological evidence for humans in the Americas before the last ice age was first found in the 1970s. A notable example is the "Luzia Woman" skull found in Brazil.
Mixing with Old World Populations
A lot of genetic mixing has happened since the European colonization of the Americas.
South and Central America
In Latin America, there was significant mixing between Indigenous American people, Europeans, and African people brought as slaves. Around the 1700s, a system of terms developed in Latin America to describe the different mixed-race groups.
Many people who identify as one race actually have genetic evidence of mixed ancestry. The European conquest of South and Central America began in the late 15th century. It was first carried out by male soldiers and sailors from Spain and Portugal. These new soldier-settlers had children with Indigenous American women and later with African slaves. These mixed-race children were often called "Castas" by the Spanish and Portuguese colonists.
North America
The North American fur trade in the 16th century brought many more European men. These men were from France, Ireland, and Great Britain. They often married North Indigenous American women. Their children were known as "Métis" or "Bois-Brûlés" by the French colonists. The English and Scottish colonists called them "mixed-bloods" or "country-born".
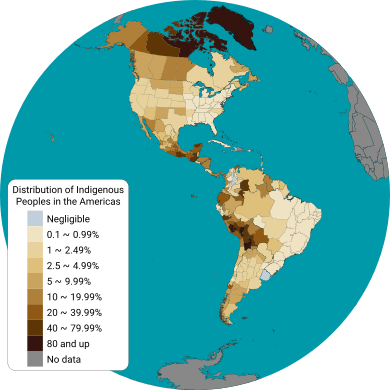
Native Americans in the United States are more likely than other groups to marry outside their race. This means there's a decreasing amount of Indigenous ancestry among those who identify as Native American. In the United States 2010 census, almost 3 million people said their race was Native American. This is based on self-identification.
Many people claim Cherokee ancestry, even without clear family records. This is sometimes called the "Cherokee Syndrome." It's about choosing an ethnic identity that is seen as prestigious. In the Eastern United States, Native American identity is often not strongly linked to genetic ancestry. It's especially embraced by people who are mostly of European descent. Some tribes have rules to protect their racial heritage, often using a Certificate of Degree of Indian Blood. They may remove tribal members who can't prove their Native American ancestry. This has become a big issue in Native American reservation politics.
European Diseases and Genetic Changes
A team led by Ripan Malhi studied how European diseases affected Native American genes. They looked at immune-related genes in ancient and modern Native American DNA. They found that a gene variant called HLA-DQA1 was present in almost 100% of ancient remains. But it was only in 36% of modern Native Americans. This gene helps the body tell the difference between healthy cells and invading viruses or bacteria.
These findings suggest that European diseases like smallpox changed the disease landscape in the Americas. Survivors of these outbreaks were less likely to carry variants like HLA-DQA1. This made them less able to fight new diseases. Scientists estimate this genetic change happened around 175 years ago, when the smallpox epidemic was widespread in the Americas.
Blood Groups: Another Clue
Before DNA was confirmed as the material of heredity in 1952, scientists used blood proteins to study human genetic differences. The ABO blood group system was discovered by Karl Landsteiner in 1900. Blood groups are inherited from both parents. The ABO blood type is controlled by a single gene with three alleles: i, IA, and IB.
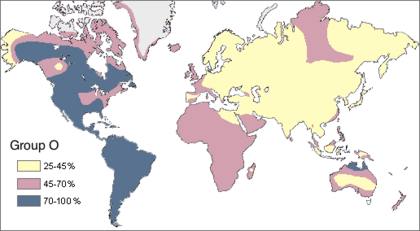
Studies during World War I found that the frequencies of blood groups A, B, and O varied greatly by region. Blood type "O" is very common worldwide, found in 63% of all human populations. Type "O" is the main blood type among Indigenous populations of the Americas. It's almost 100% common in Central and South American populations. In Indigenous North American populations, the frequency of type "A" ranges from 16% to 82%. This again suggests that the first Indigenous Americans came from a small, isolated group of people.
The main reason for such a high number of Native Americans having blood type O is Genetic drift. This means that because Native American populations were small, other blood genes were almost completely absent over generations. Another idea is the Bottleneck explanation. It suggests that there were high numbers of blood types A and B among Native Americans. But a huge population decline in the 1500s and 1600s, caused by diseases from Europe, led to many deaths of those with blood types A and B. By chance, a large number of the survivors were type O.
| PEOPLE GROUP | O (%) | A (%) | B (%) | AB (%) |
|---|---|---|---|---|
| Blackfoot Confederacy (N. American Indian) | 17 | 82 | 0 | 1 |
| Bororo (Brazil) | 100 | 0 | 0 | 0 |
| Eskimos (Alaska) | 38 | 44 | 13 | 5 |
| Inuit (Eastern Canada & Greenland) | 54 | 36 | 23 | 8 |
| Hawaiians (Polynesians, non-Amerindian) | 37 | 61 | 2 | 1 |
| Indigenous North Americans (as a whole Native Nations/First Nations) | 79 | 16 | 4 | 1 |
| Maya (modern) | 98 | 1 | 1 | 1 |
| Navajo | 73 | 27 | 0 | 0 |
| Peru | 100 | 0 | 0 | 0 |
The Dia antigen of the Diego antigen system is found only in Indigenous peoples of the Americas and East Asians. It's also found in people with some ancestry from those groups. The amount of Dia antigen in different Indigenous groups varies from almost 50% to 0%. These differences in antigen frequency are linked to major language families and environmental conditions.
See also
 In Spanish: Historia genética de los indígenas de América para niños


