
San Mateo County, California facts for kids
Quick facts for kids
San Mateo County
|
||
|---|---|---|
| County of San Mateo | ||
   Images, from top down, left to right: View of San Francisco Bay from the San Francisco Bay Discovery Site, San Mateo County Government Center, Año Nuevo State Park
|
||
|
||
| Motto(s):
All of California in One County
|
||

Location in California
|
||
| Country | United States | |
| State | California | |
| Incorporated | April 19, 1856 | |
| Named for | Saint Matthew (English translation) | |
| County seat and largest city by area |
Redwood City | |
| Largest city by population | San Mateo | |
| Government | ||
| • Type | Council–CEO | |
| • Body | Board of Supervisors | |
| Area | ||
| • Total | 744 sq mi (1,930 km2) | |
| • Land | 448 sq mi (1,160 km2) | |
| • Water | 293 sq mi (760 km2) | |
| Highest elevation | 2,603 ft (793 m) | |
| Population | ||
| • Total | 764,442 | |
| • Density | 1,704/sq mi (658/km2) | |
| GDP | ||
| • Total | $177.912 billion (2022) | |
| Time zone | UTC-8 (Pacific Time Zone) | |
| • Summer (DST) | UTC-7 (Pacific Daylight Time) | |
| Area codes | 415/628, 650 | |
| FIPS code | 06-081 | |
| GNIS feature ID | 277305 | |
| Congressional districts | 15th, 16th | |

San Mateo County is a county in California, United States. It is part of the San Francisco Bay Area. As of 2020, about 764,442 people live here. Redwood City is the county seat, which means it's where the main government offices are.
San Mateo County is known for being part of Silicon Valley. It has one of the highest household incomes in the country. The county covers most of the San Francisco Peninsula. It has many suburban areas and is home to large company offices.
Contents
History of San Mateo County
San Mateo County was created in 1856. Before that, it was part of San Francisco County. The California government decided to split the county into two parts. Everything south of a line near San Bruno Mountain became the new San Mateo County. Everything north became the City and County of San Francisco.
The county officially started on April 18, 1857. Redwood City was chosen as the county seat. Later, San Mateo County added some land from northern Santa Cruz County in 1868. This included areas like Pescadero.
There were some disagreements about where the county seat should be. In 1856, an election tried to make Belmont the county seat. But these results were found to be unfair. So, the government moved to Redwood City in 1858. Redwood City has been the county seat ever since.
The name San Mateo comes from the Spanish name for Saint Matthew. This name appeared on maps as early as 1776. It was used for a settlement, a creek, a headland, and a large land area.
Japanese Americans in San Mateo County
Japanese people first came to San Mateo County in 1872. They were part of a group led by Ambassador Tomomi Iwakura. Many young Japanese men came to San Mateo to learn English and other useful skills. They wanted to take these skills back to Japan. Some of these students were among the first Japanese to attend the Belmont School for Boys. They worked for their food and housing while studying.
Many early Japanese immigrants found jobs as gardeners and landscapers. They often had good education from their home country. But, it was hard for them to find other jobs at first because they did not know English well.
Geography of San Mateo County
San Mateo County covers about 741 square miles. About 448 square miles are land, and 293 square miles are water. It is the third smallest county in California by land area. Many creeks flow into the San Francisco Bay on the east side of the county. Other streams flow into the Pacific Ocean on the west side.
The northern and eastern parts of the county have many cities and towns. These areas are very populated. The southern and west-central parts of the county are more rural. They have fewer people and more coastal beaches.

Natural Features of San Mateo County
San Mateo County is located on the San Francisco Peninsula. The Santa Cruz Mountains run through the entire county. The county has many different natural areas. These include areas where rivers meet the sea, ocean areas, oak forests, redwood forests, and coastal bushes.
Many types of wildlife live here. You can find them along the San Francisco Bay shoreline, on San Bruno Mountain, and in the forests. There are also special underwater parks, called marine protected areas, off the coast. These parks help protect ocean animals and their homes.
Plants and Animals of San Mateo County
The county is home to several endangered species. These are animals and plants that are at risk of disappearing forever. Two examples are the San Francisco garter snake and the San Bruno elfin butterfly. Both of these are found only in San Mateo County. The endangered Ridgway's Rail bird lives along the shores of San Francisco Bay.
Rare wildflowers like Hickman's potentilla grow near the Pacific Ocean. Other endangered wildflowers are found near the Crystal Springs Reservoir.
In 2014, a California condor was seen near Pescadero. This was the first time a condor was spotted in San Mateo County since 1904. This condor, named "Lupine," flew over 100 miles from Pinnacles National Park.
Pumas, also called cougars or mountain lions, also live in the county.
Tule elk used to live in San Mateo County. They were an important food source for the native Ohlone people. Elk bones have been found in many old sites in the county.
Protected Areas in San Mateo County
- Don Edwards San Francisco Bay National Wildlife Refuge (part)
- Golden Gate National Recreation Area (part)
Marine Protected Areas
County Parks in San Mateo County
The San Mateo County Parks Department manages 22 parks, trails, and historic sites. The first park, Memorial Park, opened on July 4, 1924. It was created to save old redwood trees from being cut down.
| No. | Name | Image | Est. | Size | City | Ref. |
|---|---|---|---|---|---|---|
| 1 | Coyote Point
|
.jpg) |
1963 | 149 + 538 acres 60 + 218 ha |
San Mateo/Burlingame | |
| 2 | Crystal Springs
|
.jpg) |
17.5 mi 28.2 km |
Burlingame | ||
| 3 | Devil's Slide | .jpg) |
1.3 mi 2.1 km |
Pacifica/Montara | ||
| 4 | Edgewood | .jpg) |
1980 | 467 acres 189 ha |
Redwood City | |
| 5 | Fitzgerald | .jpg) |
1969 | Moss Beach | ||
| 6 | Flood | 21 acres 8.5 ha |
Menlo Park | |||
| 7 | Friendship | <1 acre 0.40 ha |
Redwood City | |||
| 8 | Huddart | .jpg) |
1948 | 974 acres 394 ha |
Woodside | |
| 9 | Junipero Serra | .jpg) |
1960 | 103 acres 42 ha |
San Bruno | |
| 10 | Memorial | 1924 | 673 acres 272 ha |
Loma Mar | ||
| 11 | Mirada Surf | 15 + 34 acres 6.1 + 13.8 ha |
El Granada | |||
| 12 | Moss Beach | 2014 | 467 acres 189 ha |
Moss Beach | ||
| 13 | Pescadero Creek | .jpg) |
1968 | 8,020 acres 3,250 ha |
Loma Mar | |
| 14 | Pillar Point |  |
2011 | 220 acres 89 ha |
Moss Beach | |
| 15 | Quarry | 517 acres 209 ha |
El Granada | |||
| 16 | Sam McDonald | .jpg) |
1970 | 850 acres 340 ha |
Loma Mar | |
| 17 | San Bruno Mountain |  |
1978 | 2,416 acres 978 ha |
Brisbane | |
| 18 | San Pedro Valley |  |
1970s | 1,052 acres 426 ha |
Pacifica | |
| 19 | Sanchez Adobe |  |
1953 | 5 acres 2.0 ha |
Pacifica | |
| 20 | Tunitas Creek Beach |  |
Half Moon Bay | |||
| 21 | Woodside Store |  |
1940 | — | Woodside | |
| 22 | Wunderlich |  |
1974 | 942 acres 381 ha |
Woodside |
The Midpeninsula Regional Open Space District also protects several natural areas in San Mateo County.
State Parks in San Mateo County
- Año Nuevo State Park
- Butano State Park
- Castle Rock State Park
- Heritage Grove
- Portola Redwoods State Park
- Quarry Park
- Burleigh H. Murray Ranch
- Pigeon Point Light Station Historic State Park
- Point Montara Light Station State Park
- San Bruno Mountain State Park
State Beaches in San Mateo County
- Año Nuevo State Reserve
- Bean Hollow State Beach
- Big Basin State Beach
- Gray Whale Cove State Beach
- Half Moon Bay State Beach
- Montara State Beach
- Pacifica State Beach
- Pebble Beach
- Pescadero State Beach
- Pomponio State Beach
- San Gregorio State Beach
- Thornton State Beach
Economy of San Mateo County
San Mateo County has a very strong economy. In 2012, it became the top wage-earning county in the U.S. This was partly because of the Facebook company's stock offering. The average weekly wage was very high, much higher than in other counties.
Homes in San Mateo County are also very expensive. In 2021, the average home value was over $1.2 million. This made it one of the most expensive counties for homes in the U.S.
Many big companies have their main offices here. These include Visa Inc, Sony Interactive Entertainment, Electronic Arts, YouTube, Genentech, GoPro, and Gilead Sciences. There are also many companies that invest in new technology businesses in Menlo Park.
Education in San Mateo County

People in San Mateo County can use the San Mateo County Libraries. These libraries are part of the Peninsula Library System. They have many branches and even a bookmobile.
The county has many public school districts. There are also Catholic and other private schools. The San Mateo County Board of Education helps manage schools. They also help with special education and programs for young children.
Some students in San Mateo County go to outdoor education in La Honda. This is a special school where kids learn about ecology. They explore forests, ponds, gardens, and beaches. The school's mascot is the banana slug.
K-12 School Districts in San Mateo County
.jpg)
Here are some of the school districts in the county:
- Unified School Districts
- Cabrillo Unified School District
- La Honda-Pescadero Unified School District
- South San Francisco Unified School District
- Secondary School Districts (High Schools)
- Jefferson Union High School District
- San Mateo Union High School District
- Sequoia Union High School District
- Elementary School Districts
- Bayshore Elementary School District
- Belmont-Redwood Shores Elementary School District
- Brisbane Elementary School District
- Burlingame Elementary School District
- Hillsborough City Elementary School District
- Jefferson Elementary School District
- Las Lomitas Elementary School District
- Menlo Park City Elementary School District
- Millbrae Elementary School District
- Pacifica School District
- Portola Valley Elementary School District
- Ravenswood City Elementary School District
- Redwood City Elementary School District
- San Bruno Park Elementary School District
- San Carlos Elementary School District
- San Mateo-Foster City Elementary School District
- Woodside Elementary School District
Private Schools in San Mateo County
These schools offer education for middle and high school students:
- Crystal Springs Uplands School (K–12)
- Junípero Serra High School (9–12, for boys)
- Menlo School (6–12)
- Mercy High School (9–12, for girls)
- Notre Dame High School (9–12, for girls)
- The Nueva School (K–12)
- Pacific Bay Christian School (K–12)
- Sacred Heart (K–12)
- Silicon Valley International (K–12)
- Stanbridge Academy (K–12)
- Woodside Priory School (6–12)
Colleges and Universities in San Mateo County
.jpg)
There are three community colleges in San Mateo County. They are all part of the San Mateo County Community College District:
- Cañada College (in Redwood City)
- College of San Mateo (in San Mateo)
- Skyline College (in San Bruno)
Transportation in San Mateo County
Major Roads
 Interstate 280
 Interstate 380
 U.S. Route 101 (Bayshore Freeway)
 State Route 1
 State Route 9
 State Route 35 (Skyline Boulevard)
 State Route 82 (El Camino Real)
 State Route 84 (Woodside Road/Bayfront Expressway/Dumbarton Bridge)
 State Route 92 (San Mateo Bridge)
 State Route 109
 State Route 114 (Willow Road)
Public Transportation in San Mateo County
Train Services

Caltrain is a train system that connects cities in San Mateo County. It goes north to San Francisco and south to San Jose. There are 13 Caltrain stations in the county.
- Caltrain stations in San Mateo County (north to south)
- Bayshore
- South San Francisco
- San Bruno
- Millbrae
- Broadway (weekends only)
- Burlingame
- San Mateo
- Hayward Park
- Hillsdale
- Belmont
- San Carlos
- Redwood City
- Menlo Park

Bay Area Rapid Transit (BART) trains serve San Francisco International Airport (SFO). They also serve the northern part of the county. There are six BART stations between Daly City and Millbrae.
- BART stations in San Mateo County (north to south)
- Daly City
- Colma
- South San Francisco
- San Bruno
- San Francisco International Airport
- Millbrae
The only place where Caltrain and BART connect directly is at Millbrae station.
Bus Services
.jpg)
SamTrans provides local bus service within San Mateo County. Some routes also connect to nearby counties. Many bus routes run along El Camino Real.
All Caltrain and BART stations have connections to SamTrans bus routes. There are also free shuttle buses. These shuttles take people from train and ferry stations to local businesses.
Airports in San Mateo County

San Francisco International Airport (SFO) is located in San Mateo County. It is near San Bruno and Millbrae. However, the airport is owned and run by the City and County of San Francisco.
San Mateo County also owns two smaller airports for private planes. These are Half Moon Bay Airport and San Carlos Airport.
Water Transport in San Mateo County

The Port of Redwood City is the only deepwater port in the South San Francisco Bay. It was first used in 1850 for shipping lumber. The San Mateo Harbor District manages Pillar Point Harbor on the Pacific coast. They also manage Oyster Point Marina on San Francisco Bay.
The San Francisco Bay Ferry has routes from the South San Francisco Ferry Terminal. You can take a ferry to Oakland and Alameda. There is a free shuttle to connect ferry passengers to the South San Francisco Caltrain station.
Famous Places in San Mateo County
There are many well-known buildings and sites in San Mateo County:
- Carolands Mansion, Hillsborough
- Cow Palace, Daly City
- Uplands Mansion, Hillsborough
- Crystal Springs Reservoir, central part of county
- CuriOdyssey, San Mateo
- Filoli Mansion, Woodside
- The Flintstone House, Hillsborough
- Notre Dame de Namur University, Belmont, which includes Ralston Hall
- Pigeon Point Lighthouse, Pescadero
- Point Montara Lighthouse, Montara
- Pulgas Water Temple, Woodside
- Sanchez Adobe, Pacifica
- San Mateo County History Museum, Redwood City
- San Francisco International Airport
- Stanford Linear Accelerator Center, Menlo Park
Communities in San Mateo County
Cities in San Mateo County
Towns in San Mateo County
Census-Designated Places (CDPs)
- Broadmoor
- El Granada
- Emerald Lake Hills
- Highlands-Baywood Park
- Ladera
- La Honda
- Loma Mar
- Montara
- Moss Beach
- North Fair Oaks
- Pescadero
- West Menlo Park
Unincorporated Communities
- Burlingame Hills
- Devonshire
- Kings Mountain
- Los Trancos Woods
- Menlo Oaks
- Palomar Park
- Princeton-by-the-Sea
- San Gregorio
- Sky Londa
Population Ranking of Communities (2020 Census)
† county seat
| Rank | City/Town/etc. | Municipal type | Population (2020 Census) |
|---|---|---|---|
| 1 | San Mateo | City | 105,661 |
| 2 | Daly City | City | 104,901 |
| 3 | † Redwood City | City | 84,292 |
| 4 | South San Francisco | City | 66,105 |
| 5 | San Bruno | City | 43,908 |
| 6 | Pacifica | City | 38,640 |
| 7 | Foster City | City | 33,805 |
| 8 | Menlo Park | City | 33,780 |
| 9 | Burlingame | City | 31,386 |
| 10 | San Carlos | City | 30,722 |
| 11 | East Palo Alto | City | 30,034 |
| 12 | Belmont | City | 28,335 |
| 13 | Millbrae | City | 23,216 |
| 14 | North Fair Oaks | CDP | 14,027 |
| 15 | Half Moon Bay | City | 11,795 |
| 16 | Hillsborough | Town | 11,387 |
| 17 | Atherton | Town | 7,188 |
| 18 | El Granada | CDP | 5,481 |
| 19 | Woodside | Town | 5,309 |
| 20 | Brisbane | City | 4,851 |
| 21 | Portola Valley | Town | 4,456 |
| 22 | Broadmoor | CDP | 4,411 |
| 23 | Emerald Lake Hills | CDP | 4,406 |
| 24 | Highlands-Baywood Park | CDP | 4,027 |
| 25 | West Menlo Park | CDP | 3,930 |
| 26 | Moss Beach | CDP | 3,214 |
| 27 | Montara | CDP | 2,833 |
| 28 | Ladera | CDP | 1,557 |
| 29 | Colma | Town | 1,507 |
| 30 | La Honda | CDP | 979 |
| 31 | Pescadero | CDP | 595 |
| 32 | Loma Mar | CDP | 134 |
Images for kids
-
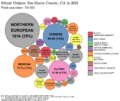
Ethnic origins in San Mateo County
-

Age distribution (2000 census)


See also
 In Spanish: Condado de San Mateo para niños
