World economy facts for kids

The world economy or global economy is like a giant network of all the money-related activities happening on Earth. It includes everything people do to make, buy, sell, and manage goods and services across all countries. Think of it as all the jobs, businesses, and trading that connect everyone around the globe.
Sometimes, people talk about the "international economy" to mean how countries trade with each other. But the "world economy" usually means adding up all the economies of every single country. It's a huge system that is connected to our planet's geography and ecology.
We usually measure the world economy using money. Even for things that don't have a clear price, like goods sold illegally, economists try to estimate their value. When comparing different countries, economists don't just use the official exchange rate (how much one country's money is worth in another). Instead, they use something called purchasing power parity (PPP). This helps them compare how much people can actually buy with their money in different places. For example, a dollar might buy more in one country than another.
For a long time, countries like China and India had the biggest economies. India was the world's largest economy for over 1,700 years! But then, the Industrial Revolution in Europe and North America changed things, and Western countries became more powerful economically. As of 2024, many countries have very large economies, including the United States, China, Germany, Japan, and India.
In 2020, the global economy actually shrank by 3.4% because of the COVID-19 pandemic. Cities, which produce a lot of the world's wealth, were hit especially hard. But in 2021, the world economy started to grow again, bouncing back by about 5.5%.
Contents
How the World Economy Works
The world economy is made up of many different parts. We can look at it by grouping countries together or by continents.
Countries Grouped by Economy Size
Countries are often grouped by how developed their economies are. Here's a look at some major groups and their economic size in 2024:
| Country group | GDP (nominal) in 2024 |
GDP (PPP) in 2024 |
Number of countries |
Major economies | ||
|---|---|---|---|---|---|---|
| Value (in millions of US$) |
Share of Global GDP |
Value (in millions of US$) |
Share of Global GDP |
|||
| Major advanced economies (G7) (Continents: Europe, North America and Asia) |
48,678,121 | 44.5% | 55,025,255 | 29.6% | 7 | |
| Emerging and developing Asia (Continents: Asia and Oceania) |
26,686,077 | 24.4% | 63,318,654 | 34.1% | 30 | |
| Other advanced economies (advanced economies excluding the G7) (Continents: Europe, Asia, Oceania and North America) |
15,134,208 | 13.8% | 20,390,379 | 11.0% | 34 | |
| Latin America and the Caribbean (Continents: South America and North America) |
7,004,688 | 6.4% | 13,364,843 | 7.2% | 33 | |
| Emerging and developing Europe (Continents: Europe and Asia) |
5,164,278 | 4.7% | 13,793,802 | 7.4% | 15 | |
| Middle East and Central Asia (Continents: Asia and Africa) |
4,965,982 | 4.5% | 13,933,205 | 7.5% | 32 | |
| Sub-Saharan Africa (Continent: Africa) |
1,895,862 (peaked at 2,011,398 in 2022) |
1.7% | 5,850,984 | 3.2% | 45 | |
| World | 109,529,216 | 100.0% | 185,677,122 | 100.0% | 196 | |
World Economy by Continent
The economy of the world can also be broken down by continents. This shows how much each continent contributes to different types of economic activities like farming (agricultural), making things (industrial), and providing services (service).
| Continent | Agricultural | Industrial | Service |
|---|---|---|---|
| World | 7,908.260 | 38,354.363 | 81,575.461 |
| Asia | 5,105.362 | 20,858.549 | 32,939.397 |
| North America | 292.467 | 5,008.594 | 18,426.200 |
| Europe | 838.199 | 8,175.402 | 20,598.902 |
| South America | 539.510 | 2,014.140 | 5,024.223 |
| Africa | 1,076.690 | 1,941.037 | 3,559.579 |
| Oceania | 56.032 | 356.641 | 1,027.160 |
Largest Economies in the World
Here are the top economies based on their GDP (the total value of goods and services produced) in different ways.
Top Economies by Nominal GDP
This table shows the 25 largest economies based on their nominal GDP, which is measured using current market prices.
| The 25 largest economies by GDP (nominal) and by GDP (PPP) as of 2024. | |||||||||||||||||||||||||||||||||||||||||||||||||||||||||||||||||||||||||||||||||||||||||||||||||||||||||||||||||||||||||||||||||||||||||||||||||||||||||||||||||||||||||||||||||||||||||||||||||||||||||||||||||||||||||||||||||||||||||||||||||||||||||||||||||||||||||||||||||||||||||||||||||||||||||||||||||||||||||||||||||||||||||||||||||||||||||||||||||||||||||||||||||||||||||||||||||||||||||||||||||||||||||||||||||||||||||||||||||||||||||||||||||||||||||||||||||||
|---|---|---|---|---|---|---|---|---|---|---|---|---|---|---|---|---|---|---|---|---|---|---|---|---|---|---|---|---|---|---|---|---|---|---|---|---|---|---|---|---|---|---|---|---|---|---|---|---|---|---|---|---|---|---|---|---|---|---|---|---|---|---|---|---|---|---|---|---|---|---|---|---|---|---|---|---|---|---|---|---|---|---|---|---|---|---|---|---|---|---|---|---|---|---|---|---|---|---|---|---|---|---|---|---|---|---|---|---|---|---|---|---|---|---|---|---|---|---|---|---|---|---|---|---|---|---|---|---|---|---|---|---|---|---|---|---|---|---|---|---|---|---|---|---|---|---|---|---|---|---|---|---|---|---|---|---|---|---|---|---|---|---|---|---|---|---|---|---|---|---|---|---|---|---|---|---|---|---|---|---|---|---|---|---|---|---|---|---|---|---|---|---|---|---|---|---|---|---|---|---|---|---|---|---|---|---|---|---|---|---|---|---|---|---|---|---|---|---|---|---|---|---|---|---|---|---|---|---|---|---|---|---|---|---|---|---|---|---|---|---|---|---|---|---|---|---|---|---|---|---|---|---|---|---|---|---|---|---|---|---|---|---|---|---|---|---|---|---|---|---|---|---|---|---|---|---|---|---|---|---|---|---|---|---|---|---|---|---|---|---|---|---|---|---|---|---|---|---|---|---|---|---|---|---|---|---|---|---|---|---|---|---|---|---|---|---|---|---|---|---|---|---|---|---|---|---|---|---|---|---|---|---|---|---|---|---|---|---|---|---|---|---|---|---|---|---|---|---|---|---|---|---|---|---|---|---|---|---|---|---|---|---|---|---|---|---|---|---|---|---|---|---|---|---|---|---|---|---|---|---|---|---|---|---|---|---|---|---|---|---|---|---|---|---|---|---|---|---|---|---|---|---|---|---|---|---|---|---|---|---|---|---|---|---|---|---|---|---|---|---|---|---|---|---|---|---|---|---|---|---|---|---|---|---|---|---|---|---|---|---|---|---|---|---|---|---|---|---|---|---|---|---|---|---|---|---|---|---|---|---|---|---|---|---|---|---|---|
| List of the 25 largest economies by GDP (nominal) at their peak level as of 2024 in million US$ |
List of the 25 largest economies by GDP (PPP) at their peak level as of 2024 in million Int$ |
List of the 28 economies by highest GDP (nominal) per capita at their peak level as of 2024 in US$ |
List of the 28 economies by highest GDP (PPP) per capita at their peak level as of 2024 in Int$' |
||||||||||||||||||||||||||||||||||||||||||||||||||||||||||||||||||||||||||||||||||||||||||||||||||||||||||||||||||||||||||||||||||||||||||||||||||||||||||||||||||||||||||||||||||||||||||||||||||||||||||||||||||||||||||||||||||||||||||||||||||||||||||||||||||||||||||||||||||||||||||||||||||||||||||||||||||||||||||||||||||||||||||||||||||||||||||||||||||||||||||||||||||||||||||||||||||||||||||||||||||||||||||||||||||||||||||||||||||||||||||||||||||||||||||||||||
|
|
|
|
||||||||||||||||||||||||||||||||||||||||||||||||||||||||||||||||||||||||||||||||||||||||||||||||||||||||||||||||||||||||||||||||||||||||||||||||||||||||||||||||||||||||||||||||||||||||||||||||||||||||||||||||||||||||||||||||||||||||||||||||||||||||||||||||||||||||||||||||||||||||||||||||||||||||||||||||||||||||||||||||||||||||||||||||||||||||||||||||||||||||||||||||||||||||||||||||||||||||||||||||||||||||||||||||||||||||||||||||||||||||||||||||||||||||||||||||
Twenty Largest Economies Over Time (Nominal GDP)
This table shows how the top 20 largest economies (by nominal GDP) have changed over the years.
Twenty Largest Economies Over Time (PPP)
This table shows the top 20 largest economies based on purchasing power parity (PPP), which gives a better idea of how much people can actually buy in different countries.
Key Economic Measures
Money and Wealth

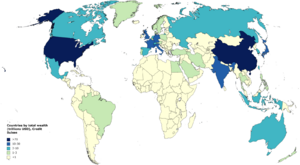
| >$60,000 $50,000 – $60,000 $40,000 – $50,000 $30,000 – $40,000 | $20,000 – $30,000 $10,000 – $20,000 $5,000 – $10,000 $2,500 – $5,000 | $1,000 – $2,500 <$1,000 No data |
- GDP (GWP) (Gross World Product): This is the total value of all goods and services produced by every country in the world combined. It's like adding up the GDP of all countries. In 2017, the GWP was about $80.27 trillion.
- GDP per person (PPP): This measures the average economic output for each person, adjusted for purchasing power. In 2017, it was about $17,500 per person.
- GDP Growth Rate: This shows how fast economies are growing.
* Developed Economies: These are countries with strong economies and advanced technology. Their GDP growth was expected to be around 2.0% in 2018. * Developing Countries: These countries are still building their industries and improving their living standards. Their GDP growth was expected to rise to 4.6% in 2018. * Least Developed Countries (LDCs): These are countries with the lowest levels of development. Their GDP growth was predicted to improve to 5.4% in 2018.
- Inflation Rate: Inflation means that prices for goods and services are generally going up over time. This means your money buys less than it used to.
* Globally, inflation was around 2.6% in 2017. * In developed countries, inflation is usually low (1% to 4%). * In developing countries, it can be much higher (5% to 60%). * For the least developed countries, inflation was 11.4% in 2017.
- Global Aid: This is money given by richer countries to help poorer ones. In 2022, about $204 billion was given as international aid.
Jobs and Work


- Unemployment Rate: This is the percentage of people who want to work but cannot find a job. In 2009, the world unemployment rate was estimated at 8.7%. In many non-industrialized countries, unemployment and underemployment (not enough work) combined could be as high as 30%.
Energy Use
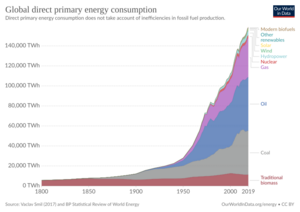
- Electricity Production: The world produced about 21,080,878 GWh of electricity in 2011.
- Oil Production and Consumption: In 2003, the world produced about 79.65 million barrels of oil per day and consumed about 80.1 million barrels per day.
- Natural Gas: In 2012, the world produced about 3,366 cubic kilometers of natural gas.
Global Trade
- Exports: In 2009, countries around the world exported goods and services worth about $12.4 trillion.
- Imports: In the same year, countries imported goods and services worth about $12.29 trillion.
- External Debt: This is the total amount of money that countries owe to foreign lenders. In 2009, this debt was estimated at $56.9 trillion.
Communication and Travel
- Telephones: In 2007, there were over 843 million landline phones and 3.3 billion mobile phones in use worldwide.
- Internet Users: By the end of 2014, over 3 billion people were using the internet.
- Airports: In 2013, there were 41,821 airports around the world.
- Roads: In 2002, there were over 32 million kilometers of roads globally, with about 19.4 million kilometers paved.
- Railways: The world has over 1.1 million kilometers of railway tracks.
Military Spending
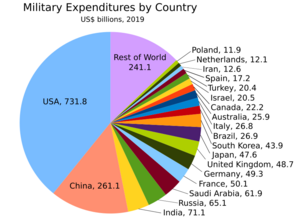
- In 2018, the world spent an estimated $1.822 trillion on military expenses. This was about 2% of the total world economy in 1999.
Science and Research
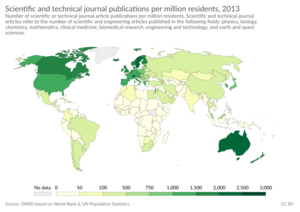
Countries invest in research and development (R&D) to create new technologies and ideas. In 2015, R&D spending was about 2.2% of the global GDP. The United States, China, and the UK are among the top countries for scientific research papers.
Resources and the Environment
Our economic activities have a big impact on the Earth's natural resources and environment.
- Forests: Forests are important for absorbing carbon and providing wood. As of 2021, about 10 billion trees are lost each year. Between 2015 and 2020, 10 million hectares of forest were lost annually.
- Soil: Healthy soil is vital for growing food. However, about 36 billion tons of soil were lost to erosion by water in 2012. This soil loss can cost about $8 billion in lost farm production each year.
- Plastic Pollution: Around 380 million tonnes of plastic are made worldwide every year. A lot of this plastic ends up in landfills or pollutes our natural environment, including the oceans.
- Air Pollution: Air pollution causes about 7 million deaths each year globally. The estimated cost of air pollution worldwide is $5 trillion annually.
- Microplastic Pollution: Tiny plastic pieces, called microplastics, are found in our oceans. In 2014, the North Atlantic Ocean was estimated to have 15 to 51 trillion microplastic particles.
How the World Economy Has Changed
The world economy has grown a lot over thousands of years. Here's a look at how the world's population and economic output (GDP) have changed over time:
| Estimations of world population and GDP from a 2020 research paper | |||
|---|---|---|---|
| Year | Population (million) |
GDP per capita ($1990 in PPP) |
GDP in billion ($1990 in PPP) |
| 1000000 BCE | 0.125 | 400 | 0.05 |
| 300000 BCE | 1 | 400 | 0.40 |
| 25000 BCE | 3.34 | 400 | 1.34 |
| 10000 BCE | 4 | 400 | 1.60 |
| 5000 BCE | 5 | 404 | 2.02 |
| 4000 BCE | 7 | 409 | 2.87 |
| 3000 BCE | 14 | 421 | 5.90 |
| 2000 BCE | 27 | 433 | 11.7 |
| 1000 BCE | 50 | 444 | 22.2 |
| 500 BCE | 100 | 457 | 45.7 |
| 200 BCE | 150 | 465 | 69.7 |
| 1 | 168 | 467 | 78.4 |
| 200 | 190 | 463 | 88.0 |
| 400 | 190 | 463 | 88.0 |
| 500 | 190 | 463 | 88.0 |
| 600 | 200 | 462 | 92.3 |
| 700 | 210 | 460 | 96.6 |
| 800 | 220 | 459 | 101 |
| 900 | 240 | 456 | 109 |
| 1000 | 265 | 453 | 120 |
| 1100 | 320 | 512 | 164 |
| 1200 | 360 | 551 | 198 |
| 1300 | 360 | 551 | 198 |
| 1400 | 350 | 541 | 190 |
| 1500 | 438 | 625 | 274 |
| 1600 | 556 | 629 | 350 |
| 1700 | 603 | 658 | 397 |
| 1820 | 1,042 | 712 | 741 |
| 1870 | 1,276 | 884 | 1,128 |
| 1900 | 1,563 | ||
| 1913 | 1,793 | 1,543 | 2,767 |
| 1920 | 1,863 | ||
| 1940 | 2,299 | 2,181 | 5,013 |
| 1950 | 2,528 | 2,104 | 5,318 |
| 1960 | 3,042 | 2,764 | 12,170 |
| 1970 | 3,691 | 3,725 | 13,751 |
| 1980 | 4,440 | 4,511 | 20,026 |
| 1990 | 5,269 | 5,149 | 27,133 |
| 2000 | 6,077 | 6,057 | 36,806 |
| 2010 | 6,873 | 7,814 | 53,704 |
| 2019 | 7,620 | 9,663 | 73,640 |
More About the World Economy
Many government groups and organizations study the world economy to help businesses trade internationally. They publish reports about different industries and countries.
See also
- Capitalism
- Economic bubble
- Globalization
- International trade
- Trade route
- World history
- Economic history of the world
Regional economies:
- Economy of Africa
- Economy of Asia
- Economy of Europe
- Economy of North America
- Economy of Oceania
- Economy of South America
Events:
Lists:
- List of world's largest economies (nominal)
- List of world's largest economies (PPP)
- Historical list of world's largest economies (PPP)
 | Toni Morrison |
 | Barack Obama |
 | Martin Luther King Jr. |
 | Ralph Bunche |


