
Meteorology facts for kids

Meteorology is the science that studies Earth's atmosphere. People who study meteorology are called meteorologists. They record things like air pressure, wind speed and direction, temperature, and humidity. Meteorologists use this information to understand weather and to predict it. Meteorology is a big part of earth science.
Meteorologists study why certain weather conditions happen. They get information from the land, sea, and the upper atmosphere. They use computer models and math to make forecasts. These forecasts can be for short or long periods. Many different groups use these weather forecasts, including:
- transport services, especially air and sea travel
- shipping and sea fishing businesses
- government services, like firefighters
- armed forces
- farmers
- mass media (like TV news)
- insurance companies
Besides forecasting, meteorologists also study how weather affects the environment. They research weather patterns, climate change, and ways to predict weather better.
Contents
Types of Meteorology
The study of the atmosphere can be divided into different areas.
Studying Air Near the Ground
Boundary layer meteorology looks at the air layer right above Earth's surface. This layer is called the atmospheric boundary layer (ABL). The surface, whether it's land or water, causes heating, cooling, and friction. This leads to mixing within the air. This area is important for understanding how heat and moisture move in the air. It includes studying air over oceans, lakes, cities, and rural areas.
Studying Medium-Sized Weather
Mesoscale meteorology studies weather events that are medium-sized. These events are larger than very small local winds but smaller than huge weather systems. They start at the Earth's surface and go up through the troposphere and lower stratosphere.
Mesoscale weather events can last from less than a day to several weeks. Examples include thunderstorms, squall lines (lines of thunderstorms), fronts, and rain bands in tropical storms. It also includes weather systems caused by land features, like mountain winds or sea breezes.

Studying Large-Scale Weather
Synoptic scale meteorology looks at very large weather systems. These are usually shown on weather maps for a specific time. Examples include large cyclones, frontal zones, and jet streams. The smallest size for these events is limited by how far apart weather stations are.

Studying Global Weather Patterns
Global scale meteorology studies huge weather patterns. These patterns move heat from the tropics (warm areas) to the poles (cold areas). Very large, long-lasting changes in weather are also important here. These changes can last longer than a year, like El Niño or the PDO. This area often crosses over into the study of climate.
Understanding Air Physics

Dynamic meteorology focuses on the physics of the atmosphere. It uses the idea of an "air parcel," which is like a tiny bit of air. This helps scientists study the atmosphere using the basic rules of how fluids move and how heat works. Things like temperature, density, and pressure are used to describe the atmosphere's state.
Weather for Air Travel
Aviation meteorology deals with how weather affects air travel. It's very important for pilots to know how weather will impact their flight and their aircraft. For example, ice on an airplane can reduce its lift and increase drag, making it harder to fly safely. Even a small amount of ice can greatly affect a plane's performance.
Weather for Farming
Agricultural meteorology studies how weather and climate affect plants and farming. Scientists in this field look at how weather influences where plants grow, how much food crops produce, and how efficiently plants use water. They also study how plants and animals develop. They are also interested in how plants affect weather and climate.
Weather and Water
Hydrometeorology is the part of meteorology that deals with the water cycle. This includes how much water is in the atmosphere and how much rain or snow falls during storms. A hydrometeorologist predicts how much rain or snow will accumulate. They also warn about areas where flash flooding might happen. This field combines knowledge from climatology, medium-scale, and large-scale meteorology.
History of Meteorology


Early Observations and Forecasts
The invention of the electrical telegraph in 1837 changed weather study. For the first time, people could quickly gather weather observations from many places. This data helped create maps of the atmosphere and see how weather changed over time.
To make regular forecasts, a good network of observations was needed. In 1849, the Smithsonian Institution in the United States started setting up such a network. Similar networks began in Europe.
In 1854, the United Kingdom government created the first national weather service. It was led by Robert FitzRoy. This office later became the United Kingdom Meteorological Office. The first daily weather forecasts from FitzRoy's office were printed in The Times newspaper in 1860. Soon after, they started using storm warning cones at ports when bad weather was expected.
Over the next 50 years, many countries started their own national weather services. These included Finland (1881), India (1889), the United States Weather Bureau (1890), and the Australian Bureau of Meteorology (1905).
Understanding the Coriolis Effect
Scientists slowly began to understand how Earth's rotation affects air movement. By the late 1800s, they fully understood how the pressure gradient force and a deflecting force cause air masses to move along lines of equal pressure (called isobars).
In the early 1900s, this deflecting force was named the Coriolis effect. It was named after Gaspard-Gustave de Coriolis, who had studied how rotating machines work. In 1856, William Ferrel suggested that the Coriolis force helps create the strong westerly winds we often feel.
Weather Prediction with Computers

In 1904, Norwegian scientist Vilhelm Bjerknes first thought that weather could be predicted using natural laws and calculations.
In the early 20th century, new discoveries in atmospheric physics led to modern numerical weather prediction. In 1922, Lewis Fry Richardson wrote a book explaining how to predict weather using math. However, the huge number of calculations needed meant it couldn't be done without computers.
Around this time, a group of meteorologists in Norway, led by Vilhelm Bjerknes, developed a model. This model explained how mid-latitude cyclones (large storms) form and die out. They introduced the idea of fronts, which are clear boundaries between different air masses.
In the 1950s, using computers for weather prediction became possible. The first weather forecasts made this way could successfully predict the large movements of Rossby waves, which are patterns of lows and highs.
In the 1960s, Edward Norton Lorenz discovered that the atmosphere is chaotic. This means tiny changes can lead to big differences later. This led to the field of chaos theory. Today, most major forecasting centers use "ensemble forecasting." This means they run many forecasts with slightly different starting conditions to account for this chaotic nature.
Weather Tools

Meteorology doesn't use much lab equipment. Instead, it relies on tools that observe weather in the field.
An "observable" in science is something that can be measured. In the atmosphere, many things can be measured. Rain, which can be seen, was one of the first things measured. Wind and humidity, which can be felt but not seen, were also measured early on. In the mid-1400s, devices like the rain gauge, anemometer (for wind), and hygrometer (for humidity) were invented.
Measurements taken at the surface are very important. They give a snapshot of weather conditions at one place, like a weather station, a ship, or a weather buoy. These measurements usually include temperature, pressure, wind, and humidity. They are taken with a thermometer, barometer, anemometer, and hygrometer.
Data from the upper air is also very important for forecasting. The most common way to get this data is by launching radiosondes. These are small boxes with sensors carried by balloons. A network of aircraft also collects weather data, organized by the World Meteorological Organization.
Remote sensing in meteorology means collecting weather data from a distance. Common types include Radar, Lidar, and satellites. These tools collect data about the atmosphere from far away. RADAR and LIDAR send out EM radiation to "see" parts of the atmosphere.
In 1960, the first successful weather satellite, TIROS-1, was launched. This meant weather information became available globally. Weather satellites are now vital for studying many things, from forest fires to El Niño.
Recently, climate models have become very detailed. These models are used to study long-term climate changes. They help scientists understand what effects human activities, like releasing greenhouse gases, might have.
How Weather is Predicted

Weather forecasting is using science and technology to predict the future state of the atmosphere for a certain time and place. People have tried to predict weather for thousands of years. Today, forecasts are made by collecting detailed data about the current atmosphere. Then, scientists use their knowledge of atmospheric processes to guess how the atmosphere will change.
In the past, forecasting was done by humans. They looked at barometric pressure changes, current weather, and sky conditions. Now, computer models are used to figure out future conditions. However, human meteorologists are still needed. They choose the best model, recognize patterns, and understand how models work.
The atmosphere is chaotic. This means that small errors in measuring current conditions can lead to bigger errors in the forecast. Also, huge computing power is needed to solve the equations that describe the atmosphere. Because of this, forecasts become less accurate the further into the future they try to predict. Using many models together (called ensembles) helps reduce errors and find the most likely outcome.
Many people use weather forecasts. Weather warnings are very important because they help protect lives and property. Forecasts about temperature and precipitation are important for agriculture and businesses. Utility companies use temperature forecasts to guess how much energy people will need. Every day, people use forecasts to decide what to wear or to plan outdoor activities. Knowing about heavy rain, snow, or wind chill helps people plan ahead and stay safe.
| Other important words in meteorology |
Atmospheric conditions: Absolute stable air | Temperature inversion | precipitation | Cyclone | anticyclone | Thermal | Tropical cyclone (hurricane or typhoon) | Vertical draft | Extratropical cyclone Weather forecasting: atmospheric pressure | Low pressure area | High pressure area | dew point | weather front | jet stream | windchill | heat index Storm: thunderstorm | lightning | thunder | hail | tornado | convection | blizzard | supercell Climate: El Niño | monsoon | flood | drought | Global warming Other phenomena: deposition | dust devil | fog | tide | wind | cloud | air mass | evaporation | sublimation | ice | crepuscular rays | anticrepuscular rays Weather-related disasters: weather disasters | extreme weather Climatic or Atmospheric Patterns: Alberta clipper | El Niño | Derecho | Gulf Stream | La Niña | Jet stream | North Atlantic Oscillation | Madden-Julian oscillation | Pacific decadal oscillation | Pineapple Express | Sirocco | Siberian Express | Walker circulation |
Images for kids
-
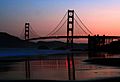
Twilight at Baker Beach
-
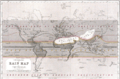
This "Hyetographic or Rain Map of the World" was first published in 1848 by Alexander Keith Johnston.
-
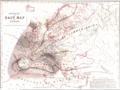
This "Hyetographic or Rain Map of Europe" was also published in 1848 as part of "The Physical Atlas."
-
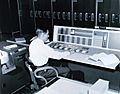
A meteorologist at the console of the IBM 7090 in the Joint Numerical Weather Prediction Unit. c. 1965
-
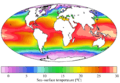
Annual mean sea surface temperatures.


See also
 In Spanish: Meteorología para niños
