
List of countries by apple production facts for kids
Have you ever wondered where the apples you eat come from? This article shows which countries grew the most apples between 2019 and 2022. The information comes from the Food and Agriculture Organization Corporate Statistical Database, which collects data about food around the world. In 2022, people around the world grew over 95 million metric tonnes of apples! A metric tonne is 1,000 kilograms, or about 2,200 pounds. That's a huge amount, and it was even more than the year before.
Contents
Countries That Grow the Most Apples
This section lists countries by how many apples they produced in different years. The numbers are in metric tonnes. You can see which countries are the biggest apple growers!
Over 1,000,000 Tonnes of Apples
These countries produced more than one million metric tonnes of apples each year. China is by far the largest apple producer in the world!
| Rank | Country/region | 2022 | 2021 | 2020 | 2019 |
|---|---|---|---|---|---|
| – | World | 95,835,965 | 93,924,721 | 90,603,540 | 87,462,289 |
| 1 | 47,571,800 | 45,983,400 | 44,066,100 | 42,425,400 | |
| 2 | 4,817,500 | 4,493,264 | 4,300,486 | 3,618,752 | |
| 3 | 4,429,330 | 4,505,310 | 4,665,199 | 5,028,526 | |
| 4 | 4,264,700 | 4,067,400 | 3,555,200 | 3,080,600 | |
| 5 | 2,589,000 | 2,276,000 | 2,814,000 | 2,316,000 | |
| 6 | 2,379,900 | 2,215,300 | 2,040,700 | 1,950,800 | |
| 7 | 2,256,240 | 2,211,740 | 2,462,440 | 2,303,690 | |
| 8 | 1,989,734 | 2,767,822 | 2,241,100 | 2,241,124 | |
| 9 | 1,785,660 | 1,633,080 | 1,743,360 | 1,753,500 | |
| 10 | 1,479,683 | 1,561,452 | 1,612,626 | 1,607,826 | |
| 11 | 1,313,233 | 1,238,188 | 1,148,455 | 1,124,017 | |
| 12 | 1,231,867 | 1,148,771 | 998,785 | 895,399 | |
| 13 | 1,129,120 | 1,278,870 | 1,114,570 | 1,153,970 | |
| 14 | 1,070,980 | 1,004,630 | 1,023,320 | 991,450 | |
| 15 | 1,047,217 | 1,297,424 | 983,255 | 1,222,949 |
100,000 to 1,000,000 Tonnes of Apples
These countries produced between 100,000 and one million metric tonnes of apples.
| Rank | Country/region | 2022 | 2021 | 2020 | 2019 |
|---|---|---|---|---|---|
| 16 | 934,414 | 863,370 | 751,200 | 701,435 | |
| 17 | 922,820 | 889,736 | 778,866 | 809,762 | |
| 18 | 817,806 | 631,767 | 714,203 | 761,483 | |
| 19 | 801,533 | 798,587 | 795,642 | 792,079 | |
| 20 | 758,298 | 732,287 | 671,716 | 603,922 | |
| 21 | 737,100 | 661,900 | 763,300 | 701,600 | |
| 22 | 575,553 | 567,162 | 559,926 | 555,627 | |
| 23 | 566,041 | 515,931 | 422,115 | 535,324 | |
| 24 | 555,998 | 463,593 | 631,597 | 610,444 | |
| 25 | 543,380 | 593,700 | 537,470 | 492,700 | |
| 26 | 539,852 | 522,317 | 566,824 | 558,830 | |
| 27 | 532,700 | 532,700 | 532,655 | 336,697 | |
| 28 | 496,305 | 615,830 | 522,100 | 638,840 | |
| 29 | 486,215 | 513,238 | 489,426 | 499,578 | |
| 30 | 447,700 | 674,700 | 480,368 | 610,921 | |
| 31 | 423,343 | 514,000 | 587,000 | 547,846 | |
| 32 | 380,571 | 351,565 | 390,999 | 382,771 | |
| 33 | 350,100 | 514,520 | 398,710 | 498,330 | |
| 34 | 331,821 | 301,610 | 267,823 | 286,564 | |
| 35 | 318,197 | 308,386 | 301,411 | 292,736 | |
| 36 | 318,000 | 321,672 | 270,857 | 250,324 | |
| 37 | 300,518 | 284,897 | 262,966 | 265,150 | |
| 38 | 291,190 | 368,230 | 286,080 | 370,710 | |
| 39 | 289,180 | 286,860 | 303,580 | 277,110 | |
| 40 | 267,919 | 262,809 | 259,128 | 216,540 | |
| 41 | 260,610 | 206,290 | 258,220 | 239,210 | |
| 42 | 248,209 | 255,011 | 245,150 | 216,860 | |
| 43 | 238,600 | 249,740 | 168,030 | 241,860 | |
| 44 | 237,616 | 238,722 | 237,980 | 236,146 | |
| 45 | 236,000 | 245,000 | 220,000 | 273,000 | |
| 46 | 211,101 | 82,591 | 109,071 | 98,265 | |
| 47 | 209,029 | 167,911 | 237,232 | 196,223 | |
| 48 | 164,530 | 92,863 | 105,794 | 88,701 | |
| 49 | 137,102 | 136,652 | 136,920 | 137,734 | |
| 50 | 133,022 | 143,265 | 139,514 | 144,868 | |
| 51 | 131,350 | 114,960 | 115,590 | 99,500 | |
| 52 | 127,000 | 128,000 | 153,000 | 116,000 | |
| 53 | 104,000 | 101,000 | 104,000 | 104,000 | |
| 54 | 103,645 | 111,247 | 102,167 | 107,713 |
50,000 to 100,000 Tonnes of Apples
These countries produced between 50,000 and 100,000 metric tonnes of apples.
| Rank | Country/region | 2033 | 2021 | 2020 | 2019 |
|---|---|---|---|---|---|
| 55 | 87,542 | 87,914 | 84,676 | 81,674 | |
| 56 | 77,800 | 78,917 | 79,413 | 75,831 | |
| 57 | 76,700 | 73,700 | 89,000 | 44,300 | |
| 58 | 64,831 | 64,658 | 66,321 | 63,513 | |
| 59 | 51,420 | 36,440 | 51,880 | 32,070 |
10,000 to 50,000 Tonnes of Apples
Here are countries that produced between 10,000 and 50,000 metric tonnes of apples.
| Rank | Country/region | 2022 | 2021 | 2020 | 2019 |
|---|---|---|---|---|---|
| 60 | 49,989 | 47,865 | 45,205 | 31,386 | |
| 61 | 49,840 | 46,987 | 37,039 | 42,322 | |
| 62 | 48,840 | 23,010 | 66,120 | 54,270 | |
| 63 | 46,810 | 59,690 | 63,610 | 68,350 | |
| 64 | 46,400 | 44,030 | 37,870 | 43,620 | |
| 65 | 44,407 | 44,727 | 44,696 | 43,798 | |
| 66 | 41,030 | 30,560 | 40,020 | 25,210 | |
| 67 | 34,714 | 32,323 | 22,554 | 21,946 | |
| 68 | 31,540 | 32,230 | 29,360 | 22,210 | |
| 69 | 31,070 | 29,590 | 28,430 | 35,190 | |
| 70 | 26,043 | 25,895 | 25,719 | 25,326 | |
| 71 | 23,200 | 15,860 | 19,470 | 19,880 | |
| 72 | 17,077 | 18,721 | 12,055 | 15,753 | |
| 73 | 16,157 | 17,007 | 19,613 | 21,051 | |
| 74 | 13,357 | 13,081 | 12,228 | 12,441 | |
| 75 | 10,085 | 22,612 | 16,260 | 8,430 | |
| 76 | 10,040 | 8,200 | 13,900 | 10,390 |
1,000 to 10,000 Tonnes of Apples
These countries produced between 1,000 and 10,000 metric tonnes of apples.
| Rank | Country/region | 2022 | 2021 | 2020 | 2019 |
|---|---|---|---|---|---|
| 77 | 7,210 | 7,192 | 7,164 | 7,274 | |
| 78 | 7,165 | 7,156 | 7,146 | 7,162 | |
| 79 | 7,010 | 7,890 | 7,170 | 8,090 | |
| 80 | 6,825 | 6,820 | 6,816 | 6,863 | |
| 81 | 3,290 | 1,970 | 1,260 | 1,850 | |
| 82 | 3,162 | 3,161 | 3,312 | 2,979 | |
| 83 | 2,900 | 3,010 | 2,670 | 1,840 | |
| 84 | 2,795 | 2,739 | 2,750 | 2,931 | |
| 85 | 2,223 | 2,324 | 4,056 | 4,321 | |
| 86 | 2,000 | 992 | 106 | 261 | |
| 87 | 1,645 | 1,516 | 1,500 | 1,482 | |
| 88 | 1,535 | 1,517 | 1,402 | 1,487 | |
| 89 | 1,400 | 1,458 | 1,041 | 1,178 | |
| 90 | 1,380 | 1,010 | 1,380 | 1,930 |
Less Than 1,000 Tonnes of Apples
These countries produced less than 1,000 metric tonnes of apples.
| Rank | Country/region | 2022 | 2021 | 2020 | 2019 |
|---|---|---|---|---|---|
| 91 | 809 | 338 | 940 | 940 | |
| 92 | 675 | 671 | 676 | 677 | |
| 93 | 473 | 469 | 465 | 456 | |
| 94 | 191 | 192 | 191 | 191 | |
| 95 | 10 | 10 | 10 | 10 |
Land Used for Apple Orchards
This section shows which countries use the most land to grow apples. The area is measured in hectares (ha). One hectare is about the size of two football fields. In 2022, the total area used for growing apples around the world was over 4.8 million hectares!
| Rank | Country | 2022 | 2021 | 2020 | 2019 |
|---|---|---|---|---|---|
| 1 | 2,128,943 | 2,103,488 | 2,082,849 | 2,041,197 | |
| 2 | 315,000 | 313,000 | 310,000 | 308,000 | |
| 3 | 232,842 | 222,516 | 210,592 | 207,003 | |
| 4 | 170,941 | 168,811 | 170,903 | 174,439 | |
| 5 | 151,900 | 161,900 | 152,600 | 155,620 | |
| 6 | 122,459 | 111,575 | 109,849 | 98,525 | |
| 7 | 116,753 | 116,874 | 119,707 | 119,301 | |
| 8 | 87,644 | 126,024 | 102,988 | 100,759 | |
| 9 | 76,900 | 84,400 | 85,000 | 87,700 | |
| 10 | 74,061 | 76,044 | 77,429 | 78,296 |
Images for kids
-
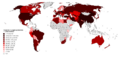
Countries by apple production in 2016
-
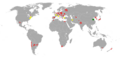
A map of apple output in 2005
-
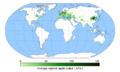
A map of world apple producing regions in 2000


