
Murray–Darling basin facts for kids
Quick facts for kids Murray-Darling basin |
|
|---|---|

|
|

Map of the Murray–Darling basin
|
|
| Length | 3,375 km (2,097 mi) |
| Area | 1,061,469 km2 (409,835 sq mi) |
| Geography | |
| Country | Australia |
| States and territories |
List
|
| Rivers |
List
|
The Murray–Darling basin is a huge area in southeastern Australia. It includes all the land that drains into the Murray River and the Darling River. The Murray is Australia's longest river, and the Darling is its third longest.
This basin is super important for farming in Australia. It covers about one-seventh of the country's land. You can find it west of the Great Dividing Range. Water from the basin flows southwest into the Great Australian Bight. It stretches across most of New South Wales and Victoria. It also covers parts of Queensland, South Australia, and the Australian Capital Territory.
The basin is about 3,375 kilometers (2,097 miles) long. The Murray River itself is 2,508 kilometers (1,558 miles) long. Most of the basin, which is 1,061,469 square kilometers (409,835 square miles), is flat and low. It doesn't get much rain directly. The rivers here are long and flow slowly. They carry a lot of water, but only by Australian standards.
The Snowy Mountains Scheme helps keep water flowing into the Murray–Darling basin. This scheme provides about 2,100 gigalitres of water each year. This water is used for farming, which is worth about A$3 billion annually. This makes up over 40% of Australia's total farm production.
Contents
Who Lived Here First?
The Murray–Darling basin was originally home to many Aboriginal people. Their traditional ways of life changed a lot when Europeans arrived. Some tribes, like the Maraura and Tanganekald, tried to fight back. But over time, many Aboriginal people were forced to leave their lands or became sick.
Amazing Native Animals
The Murray–Darling basin is home to many native animal species. It's hard to know the exact numbers, but we have good estimates. A study found these animals living in the region:
- 80 types of mammals, but 62 are now extinct and 10 are in danger.
- 55 types of frogs, with 18 in danger.
- 46 types of snakes, with five in danger.
- Five types of turtles, and none are in danger.
- 34 types of fish, but almost half are threatened or need special protection.
Long ago, there were lots of fish, which was a good food source. When floods started, fish would gather in shallow waters. Today, there are only about 24 native freshwater fish species. There are also 15-25 types of marine and estuary fish. This shows a very low variety of life.
Fish Kills in 2018–2019
Around Christmas 2018 and January 2019, many fish died in the basin. First, about 10,000 fish died. Later, hundreds of thousands more died. Fish like Murray cod, golden perch, silver perch, and bony herring were affected.
Some people blamed WaterNSW for draining water from the Menindee Lakes. Only 2.5% of the water was left in the lakes. After the first fish kill, the Department of Primary Industries (DPI) and WaterNSW blamed the ongoing drought. For the second kill, the DPI said it was caused by falling temperatures disrupting algal blooms.
Animals That Don't Belong Here
Four types of carp fish were brought in to stock up fish dams. But they quickly spread into the river systems. People also helped them spread, perhaps by using small carp as live bait. These fish move easily, breed fast, and can live in shallow water. They can also survive with very little oxygen.
Carp cause problems because they stir up the riverbed when they feed. They suck up gravel, eat what they can, and then spit the rest back out. This makes the water cloudy and lowers its quality. Scientists are working on a project to create "daughterless carp." This could help get rid of carp from the river system.
Cane toads have also reached the upper parts of the Darling Basin. There are reports of them being found further down the river system. Cane toads compete with native frogs and are poisonous to native animals that eat them.
How the Rivers Flow
The Murray–Darling basin is part of a larger area called the East Australian basins. It includes smaller sections like the Naracoorte Platform.
The total water flow in the basin has been about 24,000 gigalitres (GL) per year since 1885. This is the lowest rate among the world's major river systems. About 6.0% of Australia's total rainfall falls into the basin. In most years, only half of this water reaches the sea. In dry years, even less water flows out. The total annual flows have varied a lot. For example, it was 5,000 GL in 1902 and 57,000 GL in 1956.
The waters in the basin can be divided into four main types:
- The Darling and Lachlan basins: These rivers have very different flows each year. The smallest flow can be just 1% of the average. The largest flow can be more than ten times the average. Sometimes, these rivers can stop flowing for months or even years in drier areas. Floods in the northern parts often happen in summer due to monsoons. High water use for farming and mining has greatly harmed these rivers.
- The southwestern basins (Campaspe, Loddon, Avoca, Wimmera): These areas get most of their rain in winter. However, the old, poor soil means very little rain actually runs into the rivers. So, the amount of water flowing varies a lot. Many lakes in these basins often dry up. Most water flows in winter and spring. Without big dams, these rivers often dry up in summer and autumn.
- Small rivers in South Australia: Rivers like the Angas River and the Finniss River flow into Lake Alexandrina. This lake is at the end of the Murray system. The Angas River often dries up in summer because too much water is taken from it. The Finniss River usually flows all year, but a weir cut it off during a drought in the early 2000s.
- The Murray, Murrumbidgee, and Goulburn basins: These rivers start in high mountains with rich soils. This means more rain runs into these rivers compared to other parts of the basin. So, the water flow changes less here. These rivers usually never stop flowing. The smallest flow is about 30% of the average, and the largest is about three times the average. Water levels are highest in spring when snow melts and lowest in mid-autumn.
The Murray and Darling rivers bring water from the eastern mountains. They carry it through long, flat, dry inland areas. This often creates wetlands, like The (Great) Cumbung Swamp. However, a lot of this water is taken for drinking and farming. This started in the 1890s.
Today, there are 4 big reservoirs, 14 lock and weir structures, and five coastal barriers on the Murray-Darling. About 11,500 GL of water is taken for farming, industry, and homes. Farming uses about 95% of this water, especially for growing rice and cotton. This is a big debate among scientists in Australia. They worry about how much water farming uses in such a dry area.
These large irrigation systems need a steady water supply. But the Murray-Darling rivers have unpredictable flows. During "the Big Dry" drought in the early 2000s, many rivers and streams, including the Murray-Darling, stopped flowing. The basin has over 30,000 wetlands. Eleven of these are protected by the Ramsar Convention because they are so important.
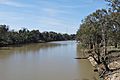
Rivers in the Murray–Darling basin
-
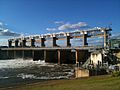
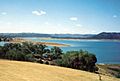
Yarrawonga Weir on the Murray River forms Lake Mulwala, 2010
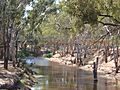
-
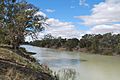
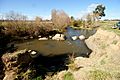
Darling River at Menindee, 2009
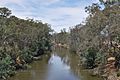
-
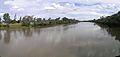
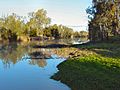
Warrego River at Cunnamulla, 2010
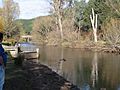
-
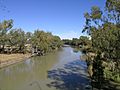
Barwon River at Collarenebri, 2008
-
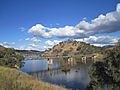
Lake Burrendong, formed at the meeting of the Macquarie River and Cudgegong River, 1995
-
Macquarie River at Bathurst, 2009
-
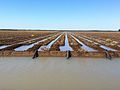
Siphon irrigation of cotton on the Balonne River near St George, 2012
-
Maranoa River at Mitchell, 2005
-
Macintyre River in flood at Goondiwindi, 1921
-
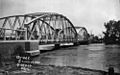
Taemas Bridge across the Murrumbidgee River, 2011
-
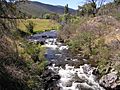
Goodradigbee River in the valley below the Brindabella Ranges, 2005
-
Molonglo River at Acton in 1920, before the damming of the river to form Lake Burley Griffin.
-
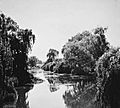
Wakool River, near Kyalite, 2012
-
A footbridge of the Avoca River at Charlton, 2005
-
Goulburn River at Murchison, 2009
-
Ovens River at Porepunkah, 2007
-
Mitta Mitta River, downstream from Dartmouth Dam, 2007


.JPG)


Here is a list of the main rivers in the Murray–Darling basin. It shows where they join other rivers and how long they are. The Swampy Plain River starts highest up in the Snowy Mountains, near Mount Kosciuszko. It drops 1,860 meters (6,100 feet) before joining the Murray River.
| Rivers of the Murray–Darling basin | ||||||||||||
|---|---|---|---|---|---|---|---|---|---|---|---|---|
| Catchment river | Elevation at confluence |
River mouth | States | River length | ||||||||
| Tributary | ||||||||||||
| Tributary | ||||||||||||
| Tributary | ||||||||||||
| Tributary | ||||||||||||
| Tributary | ||||||||||||
| Tributary | m | ft | km | mi | ||||||||
| Murray River | 0 | 0 | Southern Ocean | NSW, Vic, SA | 2,375 | 1,476 | ||||||
| Darling River | 35 | 115 | Murray | NSW | 1,472 | 915 | ||||||
| Paroo River | 94 | 308 | Darling | Qld, NSW | 1,210 | 750 | ||||||
| Warrego River | 98 | 322 | Darling | Qld, NSW | 1,380 | 860 | ||||||
| Langlo River | 280 | 920 | Warrego | Qld | 440 | 270 | ||||||
| Nive River | 336 | 1,102 | Warrego | Qld | 263 | 163 | ||||||
| Culgoa River | 109 | 358 | Darling | Qld, NSW | 489 | 304 | ||||||
| Birrie River | 115 | 377 | Culgoa | Qld | 197 | 122 | ||||||
| Barwon River (New South Wales) | 110 | 360 | Darling | NSW | 700 | 430 | ||||||
| Bokhara River | 113 | 371 | Barwon | Qld, NSW | 347 | 216 | ||||||
| Namoi River | 130 | 430 | Barwon | NSW | 708 | 440 | ||||||
| Mooki River | 264 | 866 | Namoi | NSW | 128 | 80 | ||||||
| Peel River (New South Wales) | 286 | 938 | Namoi | NSW | 210 | 130 | ||||||
| Cockburn River | 384 | 1,260 | Peel | NSW | 34 | 21 | ||||||
| Manilla River | 349 | 1,145 | Namoi | NSW | 138 | 86 | ||||||
| Macdonald River (Bendemeer) | 705 | 2,313 | Namoi | NSW | 169 | 105 | ||||||
| Cobrabald River | 990 | 3,250 | Macdonald | NSW | 53 | 33 | ||||||
| Gwydir River | 144 | 472 | Barwon | NSW | 488 | 303 | ||||||
| Horton River | 270 | 890 | Gwydir | NSW | 128 | 80 | ||||||
| Moredun Creek | 645 | 2,116 | Gwydir | NSW | 210 | 130 | ||||||
| Rocky River (New South Wales) | 760 | 2,490 | Gwydir | NSW | 138 | 86 | ||||||
| Mehi River | 145 | 476 | Barwon | NSW | 314 | 195 | ||||||
| Moonie River | 149 | 489 | Barwon | NSW | 542 | 337 | ||||||
| Boomi River | 152 | 499 | Barwon | NSW, Qld | 231 | 144 | ||||||
| Macquarie River | 154 | 505 | Barwon | NSW | 960 | 600 | ||||||
| Castlereagh River | 121 | 397 | Macquarie | NSW | 541 | 336 | ||||||
| Talbragar River | 258 | 846 | Macquarie | NSW | 277 | 172 | ||||||
| Coolaburragundy River | 271 | 889 | Talbragar | NSW | 156 | 97 | ||||||
| Little River (Dubbo) | 271 | 889 | Macquarie | NSW | 122 | 76 | ||||||
| Bell River (New South Wales) | 285 | 935 | Macquarie | NSW | 146 | 91 | ||||||
| Cudgegong River | 342 | 1,122 | Macquarie | NSW | 250 | 160 | ||||||
| Turon River | 406 | 1,332 | Macquarie | NSW | 117 | 73 | ||||||
| Crudine River | 563 | 1,847 | Turon | NSW | 54 | 34 | ||||||
| Fish River (New South Wales) | 668 | 2,192 | Macquarie | NSW | 119 | 74 | ||||||
| Campbells River | 706 | 2,316 | Fish | NSW | 82 | 51 | ||||||
| Duckmaloi River | 1,010 | 3,310 | Fish | NSW | 27 | 17 | ||||||
| Weir River (Queensland) | 166 | 545 | Barwon | Qld, NSW | 197 | 122 | ||||||
| Balonne River | 171 | 561 | Barwon | Qld | 479 | 298 | ||||||
| Maranoa River | 207 | 679 | Balonne | Qld | 519 | 322 | ||||||
| Merivale River | 401 | 1,316 | Maranoa | Qld | 205 | 127 | ||||||
| Condamine River | 256 | 840 | Balonne | Qld | 657 | 408 | ||||||
| Macintyre River | 224 | 735 | Barwon | NSW, Qld | 319 | 198 | ||||||
| Dumaresq River | 227 | 745 | Macintyre | NSW | 214 | 133 | ||||||
| Macintyre Brook | 241 | 791 | Dumaresq | Qld | 165 | 103 | ||||||
| Beardy River | 354 | 1,161 | Dumaresq | NSW | 90 | 56 | ||||||
| Pike Creek (Queensland) | 360 | 1,180 | Dumaresq | Qld | 117 | 73 | ||||||
| Mole River (New South Wales) | 363 | 1,191 | Dumaresq | Qld | 73 | 45 | ||||||
| Deepwater River | 601 | 1,972 | Mole | NSW | 84 | 52 | ||||||
| Bluff River (New South Wales) | 614 | 2,014 | Mole | NSW | 13 | 8.1 | ||||||
| Severn River (Queensland) | 375 | 1,230 | Dumaresq | Qld, NSW | 90 | 56 | ||||||
| Severn River (New South Wales) | 284 | 932 | Macintyre | NSW | 52 | 32 | ||||||
| Beardy Waters | 884 | 2,900 | Severn (NSW) | NSW | 70 | 43 | ||||||
| Bogan River | 111 | 364 | Darling | NSW | 617 | 383 | ||||||
| Little River (Parkes) | 305 | 1,001 | Bogan | NSW | 319 | 198 | ||||||
| Murrumbidgee River | 55 | 180 | Murray | NSW, ACT | 1,488 | 925 | ||||||
| Lachlan River | 68 | 223 | Murrumbidgee | NSW | 1,440 | 890 | ||||||
| Belubula River | 262 | 860 | Lachlan | NSW | 165 | 103 | ||||||
| Boorowa River | 301 | 988 | Lachlan | NSW | 134 | 83 | ||||||
| Abercrombie River | 375 | 1,230 | Lachlan | NSW | 130 | 81 | ||||||
| Isabella River (New South Wales) | 479 | 1,572 | Abercrombie | NSW | 51 | 32 | ||||||
| Bolong River | 589 | 1,932 | Abercrombie | NSW | 60 | 37 | ||||||
| Tumut River | 220 | 720 | Murrumbidgee | NSW | 182 | 113 | ||||||
| Goobarragandra River | 272 | 892 | Tumut | NSW | 56 | 35 | ||||||
| Doubtful Creek | 1,290 | 4,230 | Tumut | NSW | 15 | 9.3 | ||||||
| Yass River | 345 | 1,132 | Murrumbidgee | NSW | 139 | 86 | ||||||
| Goodradigbee River | 345 | 1,132 | Murrumbidgee | NSW | 105 | 65 | ||||||
| Crookwell River | 430 | 1,410 | Murrumbidgee | NSW | 78 | 48 | ||||||
| Molonglo River | 440 | 1,440 | Murrumbidgee | NSW, ACT | 115 | 71 | ||||||
| Jerrabomberra Creek | 554 | 1,818 | Molonglo | NSW, ACT | 35 | 22 | ||||||
| Sullivans Creek | 556 | 1,824 | Molonglo | NSW, ACT | 13 | 8.1 | ||||||
| Queanbeyan River | 567 | 1,860 | Molonglo | NSW, ACT | 104 | 65 | ||||||
| Cotter River | 460 | 1,510 | Murrumbidgee | ACT | 74 | 46 | ||||||
| Paddys River (Australian Capital Territory) | 477 | 1,565 | Cotter | ACT | 28 | 17 | ||||||
| Tidbinbilla River | 618 | 2,028 | Paddys | ACT | 13 | 8.1 | ||||||
| Gibraltar Creek | 647 | 2,123 | Paddys | ACT | 13 | 8.1 | ||||||
| Gudgenby River | 573 | 1,880 | Murrumbidgee | ACT | 35 | 22 | ||||||
| Naas River | 631 | 2,070 | Gudgenby | ACT | 26 | 16 | ||||||
| Orroral River | 842 | 2,762 | Gudgenby | ACT | 15 | 9.3 | ||||||
| Bredbo River | 695 | 2,280 | Murrumbidgee | NSW | 52 | 32 | ||||||
| Strike-a-Light River | 733 | 2,405 | Bredbo | NSW | 38 | 24 | ||||||
| Numeralla River | 706 | 2,316 | Murrumbidgee | NSW | 94 | 58 | ||||||
| Big Badja River | 735 | 2,411 | Numeralla | NSW | 32 | 20 | ||||||
| Kybeyan River | 745 | 2,444 | Numeralla | NSW | 36 | 22 | ||||||
| Wakool River | 58 | 190 | Murray | NSW | 363 | 226 | ||||||
| Niemur River | 63 | 207 | Wakool | NSW | 155 | 96 | ||||||
| Edward River (an anabranch) | 61 | 200 | Murray | NSW | 383 | 238 | ||||||
| Little Murray River (Victoria) | 67 | 220 | Murray | Vic | 46 | 29 | ||||||
| Loddon River | 71 | 233 | Murray | Vic | 392 | 244 | ||||||
| Avoca River | 74 | 243 | Murray | Vic | 270 | 170 | ||||||
| Little Murray River (New South Wales) | 75 | 246 | Murray | NSW | 22 | 14 | ||||||
| Goulburn River, Victoria | 100 | 330 | Murray | Vic | 654 | 406 | ||||||
| Broken River (Victoria) | 118 | 387 | Goulburn | Vic | 225 | 140 | ||||||
| Yea River | 162 | 531 | Goulburn | Vic | 122 | 76 | ||||||
| Murrindindi River | 186 | 610 | Yea | Vic | 26 | 16 | ||||||
| Acheron River | 190 | 620 | Goulburn | Vic | 84 | 52 | ||||||
| Little River (Cathedral Range) | 207 | 679 | Acheron | Vic | 22 | 14 | ||||||
| Steavenson River | 264 | 866 | Acheron | Vic | 20 | 12 | ||||||
| Taggerty River | 368 | 1,207 | Steavenson | Vic | 18 | 11 | ||||||
| Rubicon River | 200 | 660 | Goulburn | Vic | 43 | 27 | ||||||
| Royston River | 381 | 1,250 | Rubicon | Vic | 19 | 12 | ||||||
| Big River (Goulburn River, Victoria) | 259 | 850 | Goulburn | Vic | 62 | 39 | ||||||
| Delatite River | 260 | 850 | Goulburn | Vic | 83 | 52 | ||||||
| Howqua River | 265 | 869 | Goulburn | Vic | 66 | 41 | ||||||
| Jamieson River | 294 | 965 | Goulburn | Vic | 33 | 21 | ||||||
| Campaspe River | 123 | 404 | Murray | Vic | 232 | 144 | ||||||
| Coliban River | 183 | 600 | Campaspe | Vic | 89 | 55 | ||||||
| Little Coliban River | 501 | 1,644 | Coliban | Vic | 12 | 7.5 | ||||||
| Ovens River | 125 | 410 | Murray | Vic | 191 | 119 | ||||||
| King River, Victoria | 142 | 466 | Ovens | Vic | 126 | 78 | ||||||
| Buffalo River (Australia) | 206 | 676 | Ovens | Vic | 65 | 40 | ||||||
| Dandongadale River | 279 | 915 | Buffalo | Vic | 41 | 25 | ||||||
| Catherine River (Victoria) | 392 | 1,286 | Buffalo | Vic | 25 | 16 | ||||||
| Buckland River (Victoria) | 274 | 899 | Ovens | Vic | 38 | 24 | ||||||
| Kiewa River | 156 | 512 | Murray | Vic, NSW | 109 | 68 | ||||||
| Mitta Mitta River | 180 | 590 | Murray | Vic | 204 | 127 | ||||||
| Dart River (Victoria) | 452 | 1,483 | Mitta Mitta | Vic | 29 | 18 | ||||||
| Big River (Mitta Mitta River, Victoria) | 655 | 2,149 | Mitta Mitta | Vic | 52 | 32 | ||||||
| Cobungra River | 656 | 2,152 | Mitta Mitta | Vic | 55 | 34 | ||||||
| Victoria River (Victoria) | 830 | 2,720 | Cobungra | Vic | 25 | 16 | ||||||
| Tooma River | 238 | 781 | Murray | NSW | 74 | 46 | ||||||
| Swampy Plain River | 269 | 883 | Murray | NSW, Vic | 59 | 37 | ||||||
| Geehi River | 439 | 1,440 | Swampy Plain | Vic | 47 | 29 | ||||||
Managing the Murray–Darling Basin
Why Was the Basin Plan Created?
The Murray–Darling basin covers five states and territories. In Australia, each state manages its own water. The River Murray Commission was set up in 1917 to help. But it only looked at how much water there was. It didn't have power to make rules. Later, in 1982, they started looking at saltiness in the water too.
People soon realized a new plan was needed to manage the basin better. The Murray–Darling Basin Agreement was first made in 1985. It became a full legal agreement in 1993. This led to new groups being formed, like the Murray-Darling Basin Ministerial Council. These groups are part of the Murray-Darling Basin Initiative.
The Murray–Darling Basin Plan
The Murray–Darling Basin Authority (MDBA) was created in 2008. Its job is to manage the basin in a smart and lasting way. It works with the states. The MDBA writes and checks a plan that everyone must follow. In October 2010, the MDBA shared a first draft of the plan. After many discussions, the Murray-Darling Basin Plan was signed on November 22, 2012. It became law on March 19, 2013.
Talking to the Community
The MDBA's first draft plan was called Guide to the Proposed Murray–Darling Basin Plan. It came out in October 2010. This plan was a response to the 2000s Australian drought. It aimed to keep the basin healthy for a long time. This meant reducing how much water farmers could use.
The plan also wanted to set limits on how much water could be taken from the basin. It aimed to improve water quality and reduce saltiness. It also wanted to make water trading easier. The plan tried to avoid causing too many problems for people and businesses.
When the draft plan was released, many people in country towns were worried. More than 5,000 people went to a meeting in Griffith. The mayor there said the plan would "destroy" communities in the Murrumbidgee valley. Other groups, like farmers and wine growers, felt the same.
However, some groups supported the plan. These included the Australian Conservation Foundation and Environment Victoria.
New legal advice from the government changed the plan. It said the plan must think equally about the environment, people, and the economy. Environmental groups and farmers in South Australia wanted the MDBA to stick to its first plan.
In October 2010, a government group started looking into how the plan would affect the economy.
The Water Minister, Tony Burke, said a court challenge to the plan was unlikely. He explained that the law allows the MDBA to find the best balance for all three areas. But some lawyers still had doubts.
In November 2010, the MDBA said the final plan might be delayed until early 2012.
The MDBA chairman, Mike Taylor, promised that they would study how the water cuts would affect local communities. He said they wanted to understand the "very significant" social and economic impacts. Taylor later left his job. He believed the environment should be the top priority, which was different from the government's view. Craig Knowles took his place.
In May 2012, the updated plan was sent to state water ministers. It still suggested cutting 2,750 GL of water use.
After many talks and ideas from people, the Basin Plan became law in November 2012. Now it can be put into action.
Keeping the Basin Healthy for the Future
The Murray-Darling Basin Plan is a step towards keeping the basin healthy. But there's still a risk that human actions could make droughts worse. The River Murray has only dried up twice in recorded history. To be sure the rivers stay healthy, studies showed that 7,600 GL less water should be used each year.
However, some people worry about how big water cuts will affect farming. They say that with a growing population, especially during droughts, Australia might need to bring water from other wet parts of the country, like the Cape York Peninsula. Or they might need more desalination plants to turn salty water into fresh water.
See also
 In Spanish: Cuenca del Murray-Darling para niños
