Sea level rise facts for kids
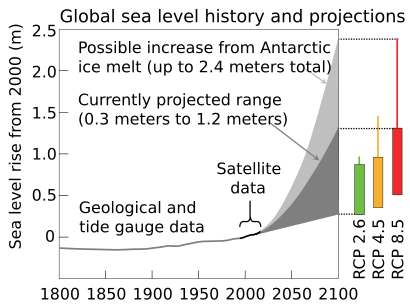
The sea level rise is when the average height of the ocean water goes up. Between 1901 and 2018, the sea level rose by about 15 to 25 centimeters (6 to 10 inches). Since the 1970s, it has been rising faster, about 2.3 millimeters (0.09 inches) each year. This is the fastest it has risen in at least 3,000 years! From 2013 to 2022, it sped up even more to 4.62 millimeters (0.18 inches) per year.
The main reason for this rise is climate change, caused by human activities. When the Earth gets warmer, two main things happen:
- Ice sheets and glaciers melt, adding water to the ocean.
- The ocean water itself gets warmer and expands, taking up more space.
Sea level rise happens slowly, so even warming that has already happened will cause the sea level to keep rising until at least 2050. What happens after that depends on how much greenhouse gases humans release. If we cut emissions a lot, the rise could slow down. If we don't, it will keep speeding up. By 2100, the sea could rise by another 30 centimeters (1 foot) or even up to 1.6 meters (5.2 feet) in the worst case. Over thousands of years, the sea could rise many meters if warming continues.
Rising seas affect people and places all over the world. This includes more flooding, bigger storm surges, and higher tides. It also harms coastal ecosystems like mangroves. Farm fields can get too salty, and ports can be damaged, making it harder to trade by sea. By 2050, millions of people could face yearly flooding. Without big cuts in emissions, this number could grow to hundreds of millions later in the century.
Some places, like the US East Coast, might see the sea rise 2 to 3 times faster than the global average. Many countries in Asia are also at high risk, including Indonesia, Bangladesh, and the Philippines. Small Pacific islands and Caribbean islands are especially in danger, with some possibly becoming unlivable later this century.
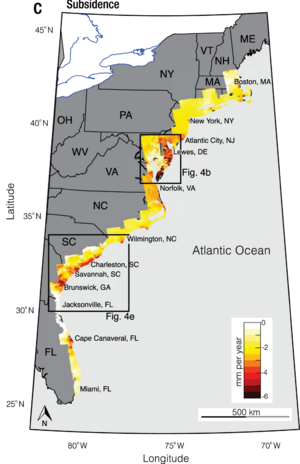
People can try to adapt to rising sea levels in different ways. Some communities might move away from the coast (called "managed retreat"). Others might build seawalls or use natural methods like planting dunes and adding sand to beaches. Poorer countries might find it harder to afford these solutions. Sometimes, other problems like land sinking (called subsidence) make sea level rise even worse in certain cities. Coastal ecosystems usually move inland as the sea rises, but buildings or other barriers can stop them.
How We See Sea Level Change
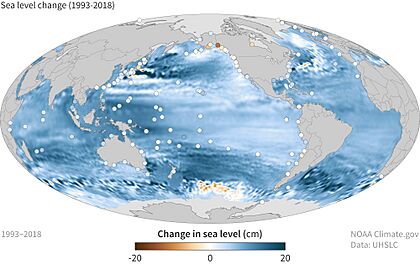
Between 1901 and 2018, the global average sea level went up by about 20 centimeters (7.9 inches). More exact measurements from satellites show it rose 7.5 centimeters (3 inches) from 1993 to 2017. This sped up to 4.62 millimeters (0.18 inches) per year from 2013 to 2022. Old climate records show this is the fastest sea level has risen in at least 3,000 years.
Different Places, Different Rises
Sea level rise doesn't happen the same way everywhere. Some land areas are moving up or down. This can be because the land is sinking (subsidence) or rising after heavy ice melted away (post-glacial rebound). So, the local sea level might rise more or less than the global average.
When a large glacier or ice sheet melts, its gravity changes, which can affect where the water goes. For example, ice melting in Greenland affects sea levels differently than ice melting in Antarctica. Also, the Atlantic Ocean is warming faster than the Pacific. This means places like Europe and the U.S. East Coast are seeing faster sea level rise. The East Coast of the U.S. is rising 3–4 times faster than the global average.
Many cities and farms are on river deltas, where land often sinks. This makes the local sea level rise even higher. Taking too much groundwater or oil and gas from underground can cause the land to sink. Also, levees built to control floods can stop new soil from building up, which normally helps keep the land from sinking. For example, parts of the Mississippi River Delta (like New Orleans) have sunk over 3 meters (10 feet). On the other hand, areas around Hudson Bay in Canada are actually seeing sea levels fall because the land is still rising after the last ice age.
What We Expect in the Future
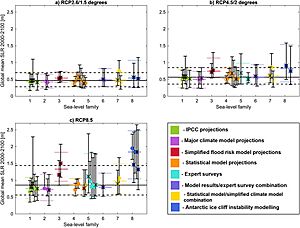
Scientists use different ways to guess how much sea level will rise. One way is to use computer models that calculate how ice melts and how water expands when it warms. Another way uses past observations and historical data to predict future changes.
In the past, some models underestimated how much sea level would rise. But now, models have improved and give similar predictions to other methods. Scientists also combine their knowledge and opinions to make the best guesses.
Sometimes, less complex models are used for specific tasks, like predicting flood risk in certain areas. There's also a theory called "ice cliff instability" for Antarctica, which suggests that ice could break apart much faster than usually thought, leading to much higher sea level rise, especially with more warming.
Predictions for the Next 75 Years
The Intergovernmental Panel on Climate Change (IPCC) is a big group of scientists who study climate change. They create different possible futures, called scenarios, for how much sea level will rise. These scenarios depend on how much greenhouse gases humans release, which is hard to predict because it depends on how economies grow and what political decisions are made. Each scenario gives a range (a low and a high guess) to show the unknowns.
In their latest report (AR6), the IPCC added a scenario where we meet the best goal of the Paris climate agreement (limiting warming to 1.5°C). In this best-case scenario, sea level would likely rise by 28–55 centimeters (11–22 inches) by 2100.

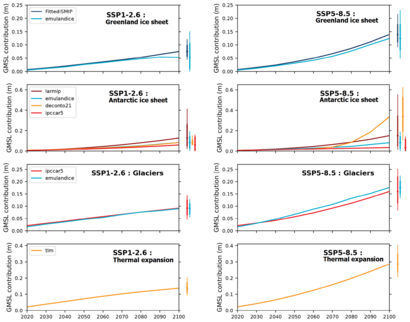
In a scenario where greenhouse gas emissions are low, sea level rise by 2100 could be around 32–62 centimeters (13–24 inches). In a "moderate" scenario, where emissions peak later, it could be 44–76 centimeters (17–30 inches). In the highest emission scenario, sea level could rise by 65–101 centimeters (26–40 inches).
Scientists have increased their predictions in recent reports because they've improved their ice sheet models. They also saw that the actual melting of ice in Greenland and Antarctica was happening faster than predicted in older reports. The latest report also includes the possibility of "ice cliff instability," which could add "tens of centimeters" more to sea level rise this century. In the worst-case scenario, with these processes, sea level rise could be as much as 1.6 meters (5.2 feet) by 2100.
How Ice Instability Plays a Role
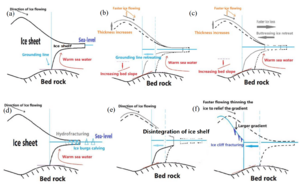
The biggest unknowns in sea level rise predictions come from something called marine ice sheet instability (MISI) and, even more so, Marine Ice Cliff Instability (MICI). These mostly affect the West Antarctic Ice Sheet and some glaciers in Greenland.
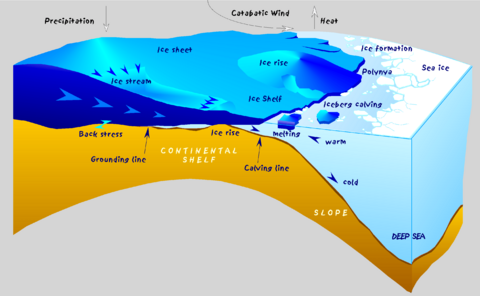
MISI means that when glaciers are mostly underwater on a backward-sloping seabed, the water melts more and more of the ice as the glacier retreats, making it break down faster. This idea is widely accepted but hard to model.
MICI suggests that very tall ice cliffs (over 90 meters or 300 feet above water) could collapse quickly under their own weight if the floating ice shelves that support them disappear. This collapse could then cause a chain reaction, leading to very fast ice sheet retreat. This theory has been very important, but it's also controversial because there isn't much real-world evidence from the past or present to fully support it happening quickly. Some scientists think that broken ice debris might build up and slow down the collapse.
To figure this out, scientists are looking at how much sea level rose during the Last Interglacial period, about 125,000 years ago, when Earth was warmer. If sea level rose a lot back then, it would support the idea of MICI. Recent studies suggest the rise was not as high as some thought, which might mean MICI is less likely to cause very rapid sea level rise in the near future.
Sea Level Rise After 2100
Even if global temperatures stop rising, sea levels will continue to go up for hundreds or even thousands of years. This is because oceans warm very slowly, and it takes a long time for ice sheets to melt completely.
By 2150, if warming is kept to 1.5°C, sea level could rise by 37–86 centimeters (15–34 inches). In the highest emission scenario, it could rise by 98–188 centimeters (39–74 inches). The IPCC also looked at extreme, low-chance scenarios where sea level could rise up to 4.82 meters (15.8 feet) by 2150.
For the year 2300, in the best-case scenario (low emissions, no ice sheet speed-up), sea level might rise 0.8–2.0 meters (2.6–6.6 feet). But in the worst-case scenario (high emissions, ice cliff instability), the sea could rise by 9.5–16.2 meters (31–53 feet) by 2300.
Over the next 2,000 years:
- If warming peaks at 1.5°C, global sea levels would rise 2–3 meters (6.6–9.8 feet).
- If warming peaks at 5°C, sea levels would rise 19–22 meters (62–72 feet).
Over 10,000 years:
- If warming peaks at 1.5°C, global sea levels would rise 6–7 meters (20–23 feet).
- If warming peaks at 5°C, sea levels would rise 28–37 meters (92–121 feet).
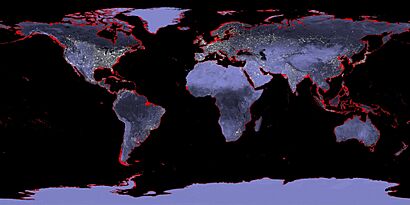
Melting all the ice on Earth would cause about 70 meters (230 feet) of sea level rise, but this would take at least 10,000 years and a lot more warming.
How We Measure Sea Level
Scientists measure sea level changes in different ways. They look at how much water is in the oceans, how much its volume changes, and how the land moves up or down compared to the sea. These measurements help them understand what's causing the changes and predict future rises.
Satellites
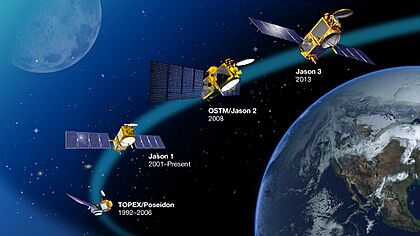
Since 1992, special satellites have been continuously measuring the sea level. These satellites send microwave pulses to the Earth and time how long it takes for the pulse to bounce back. This helps them measure the height of the sea surface very accurately, within a few centimeters. These satellite measurements show that sea level rose about 3.0 millimeters (0.12 inches) per year from 1993 to 2017.
Satellites are great for seeing how sea level changes in different regions. For example, they showed a big rise in the western tropical Pacific from 1993 to 2012, linked to changes in winds and ocean patterns.
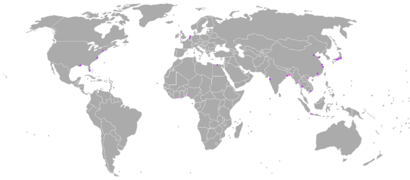
Tide Gauges
Another important way to measure sea level is with a global network of tide gauges. These devices measure the height of the sea at specific locations. While they don't cover as much area as satellites, they have been collecting data for a much longer time. The oldest measurements, in Amsterdam, started in 1675!
Combining tide gauge data with satellite data, scientists found that the global average sea level rose 19.5 centimeters (7.7 inches) between 1870 and 2004. By 2018, the rate had doubled to 3.2 millimeters (0.13 inches) per year. The 2023 report found it accelerated even more to 4.62 millimeters (0.18 inches) per year from 2013 to 2022. These observations help scientists check their climate change predictions.
Tide gauges also show regional differences. For example, sea levels along the northern Baltic Sea have actually dropped because the land there is rising after the last ice age.
Past Sea Level Rise
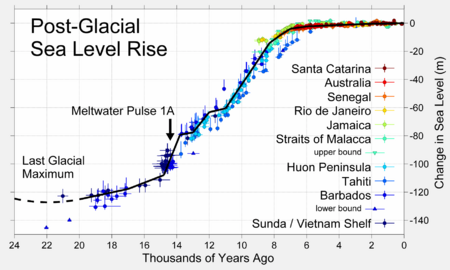
Looking at how sea levels changed in the past helps us understand what might happen in the future. In Earth's recent past, sea level rose mostly because of warmer temperatures and melting ice. The last time Earth was about 2°C warmer than before the industrial age was 120,000 years ago. During that time, sea levels were at least 5 meters (16 feet) higher than today, meaning a lot of ice from Antarctica and Greenland melted. About three million years ago, when carbon dioxide levels were similar to today, temperatures rose 2-3°C, melting a third of Antarctica's ice and raising sea levels by 20 meters (66 feet).
Since the last ice age, about 20,000 years ago, sea level has risen over 125 meters (410 feet). There were periods of very fast rise when huge ice sheets melted quickly. Sea level then stayed almost constant for the last 2,500 years. The current trend of rising sea level started in the late 1800s or early 1900s.
Why Sea Level Is Rising
The three main reasons global sea level is rising are:
- The ocean water expanding as it gets warmer.
- Water flowing in from melting ice sheets (like in Greenland and Antarctica).
- Water flowing in from melting glaciers (smaller ice bodies on mountains).
Other things like changes in snow and water stored on land also play a small role. Melting glaciers and ocean expansion have been the main causes of sea level rise since the early 1900s. While some snow falls and adds to glaciers, it's not enough to stop the overall ice loss.
The two largest ice sheets, in Greenland and Antarctica, hold most of the world's land ice (about 99.5%). If all the ice on Earth melted, sea level would rise by about 70 meters (230 feet), but this would take thousands of years.
Ocean Heating

Oceans absorb over 90% of the extra heat trapped by greenhouse gases. This means oceans act like a giant sponge, soaking up heat. A tiny change in ocean temperature means a huge amount of heat has been absorbed. Winds and currents move this heat into deeper parts of the ocean.
When ocean water gets warmer, it expands, and this causes sea level to rise. Warmer water expands more than colder water. So, warm tropical water expands more than cold Arctic water.
Antarctic Ice Loss

Antarctica holds about 60% of the world's fresh water (90% if you don't count groundwater). Some parts of Antarctica, especially West Antarctica, are losing ice from coastal glaciers. However, other parts, especially East Antarctica, are gaining mass from increased snowfall inland. This makes it tricky to figure out the overall trend.
In 2018, studies estimated that Antarctica lost an average of 43 billion tons of ice per year between 1992 and 2002. This tripled to 220 billion tons per year from 2012 to 2017. However, a 2021 study found less overall loss, around 12 billion tons per year from 2012 to 2016, due to more ice gain in East Antarctica than previously thought.
In the future, West Antarctica is expected to keep losing ice. The loss of sea ice and ice shelves (which act like barriers) could speed up melting even in East Antarctica. Antarctica is the biggest unknown when predicting future sea level rise.
East Antarctica
The East Antarctic Ice Sheet (EAIS) is the largest potential source of sea level rise. It's very thick (2.2 km or 1.4 miles on average) and holds enough ice to raise global sea levels by 53.3 meters (175 feet). Its size and height make it more stable than other ice sheets. Most studies show it's still gaining ice overall.
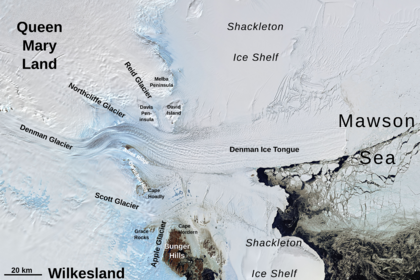
Despite gaining mass, some glaciers in East Antarctica, like Denman Glacier and Totten Glacier, have lost ice recently. This is due to warmer ocean water and less support from local sea ice. Totten Glacier is important because it helps stabilize the Aurora Subglacial Basin, which holds a lot of ice. These basins are more vulnerable than the rest of East Antarctica. If global warming reaches about 3°C, these basins could start to collapse, which could take hundreds or thousands of years and cause several meters of sea level rise.
The entire EAIS would likely not collapse unless global warming reaches about 7.5°C, and it would take at least 10,000 years to disappear.
West Antarctica
While East Antarctica holds more ice, the West Antarctic Ice Sheet (WAIS) is much more vulnerable. Temperatures in West Antarctica have risen significantly. Satellite observations show a big increase in WAIS melting from 1992 to 2017, adding about 7.6 millimeters (0.3 inches) to sea level. Glaciers in the Amundsen Sea Embayment, like Thwaites and Pine Island, are especially important.
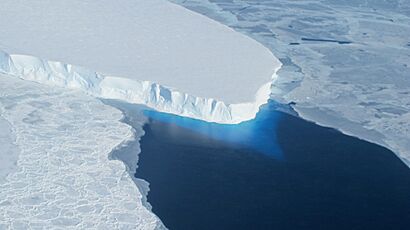
Most of the land under the WAIS is below sea level, and these glaciers act like buttresses, holding the ice sheet back. If they collapse, the entire ice sheet could follow. This would take at least several centuries but is considered almost certain to happen. The Thwaites Glacier alone now accounts for 4% of global sea level rise. If its ice shelf breaks, it could lose ice even faster.
The melting of all the ice in West Antarctica would raise global sea levels by about 4.3 meters (14 feet). This collapse seems to have happened during the Eemian period (125,000 years ago) when temperatures were similar to today, so it's likely unavoidable. This disappearance would take an estimated 2,000 years.
Once West Antarctica's ice loss starts, the only way to stop it would be to cool the Earth to below pre-industrial levels. Some scientists suggest engineering solutions to stabilize the glaciers, but this would be very expensive and uncertain.
Isostatic Rebound
When large ice sheets melt, the land underneath them can slowly rise up, like a spring released from weight. This is called isostatic rebound. Research in 2021 suggests that after the West Antarctic ice sheet melts, this rebound could add another 1.02 meters (3.3 feet) to global sea levels over 1,000 years.
Greenland Ice Sheet Loss
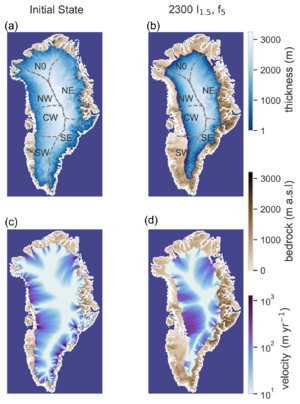
Most of Greenland's ice is in the Greenland ice sheet, which is 3 kilometers (1.9 miles) thick in places. The rest is in smaller glaciers. The average yearly ice loss in Greenland has more than doubled in the 21st century compared to the 20th century. Its contribution to sea level rise increased from 0.07 mm per year (1992-1997) to 0.68 mm per year (2012-2017). Between 1992 and 2018, Greenland lost 3,902 billion tons of ice, adding 10.8 millimeters (0.43 inches) to sea level. This melting rate is at the higher end of what scientists predicted.
The IPCC estimated that by 2100, melting of the Greenland ice sheet would most likely add about 6 centimeters (2.4 inches) to sea levels in a low-emission scenario, and 13 centimeters (5.1 inches) in a high-emission scenario.
Greenland's smaller glaciers and ice caps passed a point of no return around 1997, meaning their melting is now unstoppable. Even with current warming, the ice sheet has already been damaged enough to eventually lose about 3.3% of its volume, leading to 27 centimeters (11 inches) of future sea level rise.
Scientists believe the tipping point for the entire Greenland ice sheet is between 1.7°C and 2.3°C of warming. If temperatures reach or go above this level, the ice sheet will almost completely melt, which has happened at least once in the last million years. If this tipping point is crossed, it could take 10,000 to 15,000 years for the ice sheet to disappear completely. But if warming continues rapidly, it could happen in just 1,000 years.
Mountain Glacier Loss
There are about 200,000 glaciers around the world, but they hold less than 1% of the world's glacier ice (the rest is in Greenland and Antarctica). However, because they are smaller, mountain glaciers are more sensitive to melting. They have contributed a lot to sea level rise in the past and will continue to do so in the 21st century.
Studies show that mountain glaciers contributed 0.2-0.4 millimeters per year to sea level rise in the 20th century. From 2012 to 2016, their contribution was 0.63 millimeters per year, almost as much as Greenland's. Glaciers contributed about 40% to sea level rise in the 20th century, and are expected to contribute about 30% in the 21st century.
A 2023 study estimated that if warming is limited to 1.5°C, about a quarter of mountain glacier mass would be lost by 2100, adding about 9 centimeters (3.5 inches) to sea level. If warming reaches 4°C, nearly half would be lost, adding about 15 centimeters (5.9 inches). Most mountain glaciers are not expected to survive if warming goes above 2°C. Their complete loss is likely if warming reaches around 3°C.
Sea Ice Loss
Sea ice is ice that floats in the sea, like in the Arctic Ocean. When sea ice melts, it adds very little to global sea level rise. This is because floating ice already displaces water. If all floating ice shelves and icebergs melted, sea level would only rise by about 4 centimeters (1.6 inches).
Changes to Land Water Storage
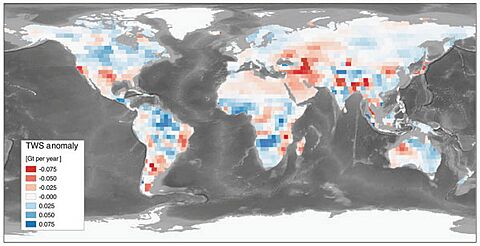
Human activities also affect how much water is stored on land. Dams hold back large amounts of water, preventing it from flowing into the sea. On the other hand, humans pump water from lakes, wetlands, and underground (aquifers) for drinking and farming. This can cause the land to sink. Also, deforestation and climate change affect the water cycle. In the 20th century, these effects mostly canceled each other out. But now, with less dam building, water extraction is becoming a bigger factor.
For example, from 1993 to 2010, irrigation caused groundwater to be used up, which added about 6.24 millimeters (0.25 inches) to global sea level rise.
What Happens When Sea Level Rises
Sea level rise has many impacts:
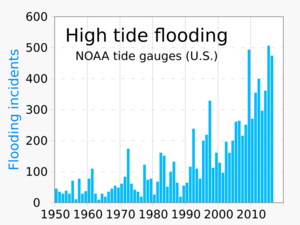
- More frequent and higher high-tide floods and storm surges.
- Increased coastal erosion, where the land gets washed away.
- Saltwater getting into freshwater sources and farm fields.
- Loss of homes, property, and important coastal habitats.
- Damage to cultural sites.
- Problems for farming, fishing, tourism, and transportation.
By 2050, sea level rise could put tens of millions of people at risk. About 150 million people could be living in areas that are underwater during high tide, and 300 million in places that flood every year. By 2100, these numbers could increase to hundreds of millions more, especially in high-emission scenarios.
Many major cities are in low-lying coastal areas, like Miami, Rio de Janeiro, Osaka, and Shanghai. These cities are very vulnerable. In 2021, studies showed that 267 million people worldwide lived on land less than 2 meters (6.6 feet) above sea level. With a 1-meter (3.3 feet) sea level rise, that number could go up to 410 million people.
Sea level rise could also disrupt sea trade and cause large-scale human migrations. The UN Secretary-General warned in 2023 that it risks causing migrations on a "biblical scale." Ports will be affected, and some coastal farmlands, like in the Nile Delta in Egypt, could be lost, leading to food shortages.
On Nature

Flooding and salty soil/water threaten coastal plants, birds, and fish. When coastal forests are flooded with saltwater, they die and become "ghost forests." Sea turtle nesting sites in places like Florida and Cuba are expected to be flooded more often starting around 2050. In 2016, a small island in the Great Barrier Reef was flooded, leading to the extinction of a rodent called the Bramble Cay melomys, the first known mammal to go extinct due to sea level rise.
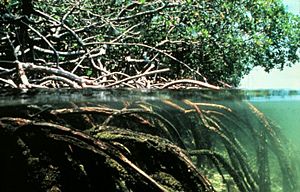
Some ecosystems, like mudflats and tidal marshes, can move inland as the sea rises. But human-made barriers, like buildings, can stop them. This is called 'coastal squeeze' and can lead to the loss of these habitats. Mangrove forests, which grow in tropical coastal areas, are especially vulnerable because their breathing roots can get submerged if the sea rises too fast. Both mangroves and tidal marshes protect against storm surges and tsunamis, so losing them makes the effects of sea level rise worse.
Corals need to grow vertically to stay close to the sunlight. While they have kept up with rising seas so far, they might not be able to in the future.
How We Can Adapt
Cutting greenhouse gas emissions can slow down sea level rise after 2050, which would reduce its costs and damages. But we can't stop it completely, so we must adapt. The simplest way is to stop building in vulnerable areas and move people and buildings away. This "retreat" can be hard because people might lose their jobs and homes.
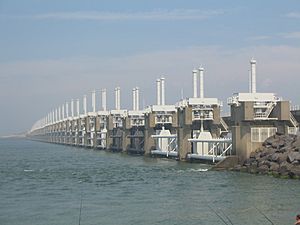
To avoid or delay retreat, we can build protections like dams, levees, or improve natural defenses. We can also update building rules to reduce flood damage, add special valves for high-tide flooding, or grow crops that can handle salty soil. These solutions can be "hard" (like building big structures) or "soft" (like strengthening natural defenses). Often, a mix of both is used.
Adapting to sea level rise costs a lot, but doing nothing would cost even more. For example, good adaptation measures could reduce future annual flood costs in 136 large coastal cities from $1 trillion to about $60 billion per year by 2050. Some experts even suggest that retreating from the coast might be cheaper for some countries than trying to protect every coastline, especially with very high sea level rise.
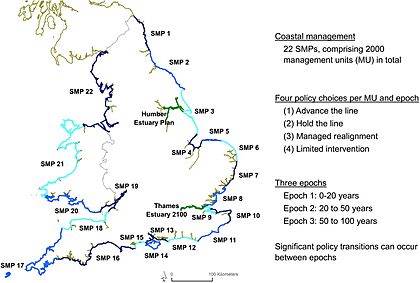
For adaptation to work, we need to plan far ahead. As of 2023, many countries are aware of sea level rise predictions, but not all have put them into their plans. About half of all planners surveyed have plans for 2050 and 2100 sea level rise, but most only use one prediction instead of a range of possibilities, including extreme scenarios.
Sea Level Rise Around the World
Africa

In Africa, the risk from sea level rise is growing because the population is increasing quickly. About 54.2 million people lived in highly exposed coastal areas around 2000. This number is expected to double to about 110 million by 2030 and reach 185 to 230 million by 2060. By 2100, Egypt, Mozambique, and Tanzania are likely to have the most people affected by yearly flooding. Also, 10 important cultural sites could be at risk of flooding and erosion.
In the short term, at least 750,000 people in East Africa might have to move away from the coasts between 2020 and 2050. By 2050, 12 major African cities could face billions of dollars in damages. About half of these damages would be in Alexandria, Egypt, where hundreds of thousands of people might need to move in the next decade. Across sub-Saharan Africa, damage from sea level rise could reach 2–4% of their economy by 2050.
Asia
Asia has the largest number of people at risk from sea level rise because so many people live along its coasts. As of 2022, about 63 million people in East and South Asia were already at risk from a "100-year flood" (a flood that has a 1% chance of happening in any given year). This is partly because many countries don't have enough coastal protection.
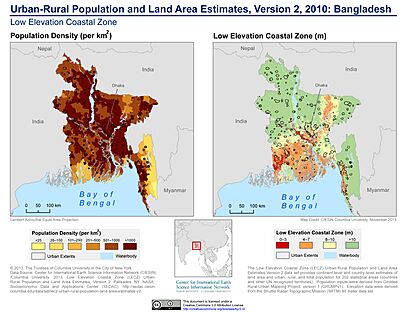
Countries like Bangladesh, China, India, Indonesia, Japan, Pakistan, the Philippines, Thailand, and Vietnam account for 70% of people exposed to sea level rise this century. In Bangladesh, sea level rise could force 0.9–2.1 million people to move by 2050. It could also force many power plants to relocate or deal with salty cooling water. Countries with a lot of rice farming on the coast, like Bangladesh, Vietnam, and China, are already seeing problems from saltwater getting into their fields.
Scientists predict that Asia will suffer huge economic damages from sea level rise. Out of the 20 coastal cities expected to have the highest flood losses by 2050, 13 are in Asia. Nine of these are "sinking cities," where the land is also sinking (often because too much groundwater was pumped out). These include Bangkok, Guangzhou, Ho Chi Minh City, Jakarta, Kolkata, Nagoya, Tianjin, Xiamen, and Zhanjiang.
By 2050, Guangzhou could see 0.2 meters (7.9 inches) of sea level rise and an estimated $254 million in yearly economic losses—the highest in the world. In Shanghai, coastal flooding could increase significantly by 2100. The city of Jakarta is sinking so much (up to 28 centimeters or 11 inches per year in some areas) that in 2019, the government decided to move the capital of Indonesia to another city.
Australasia
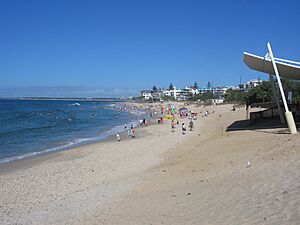
In Australia, beaches on Queensland's Sunshine Coast are likely to have 60% more erosion and flooding by 2030, which would greatly affect tourism without adaptation. Adaptation costs would be much higher in a high-emission scenario. Sea level rise of 0.2–0.3 meters (7.9–11.8 inches) is likely by 2050. With this rise, what is now a "100-year flood" would happen every year in the New Zealand cities of Wellington and Christchurch.
With 0.5 meters (1.6 feet) of sea level rise, a current 100-year flood in Australia would happen several times a year. In New Zealand, this would put buildings worth NZ$12.75 billion at risk. A meter (3.3 feet) of sea level rise would threaten NZD$25.5 billion worth of assets in New Zealand. This would especially affect Maori-owned lands and cultural sites. In Australia, assets worth AUS$164–226 billion, including many roads and railways, would also be at risk. This means Australia's flooding costs could more than double between 2020 and 2100.
Central and South America
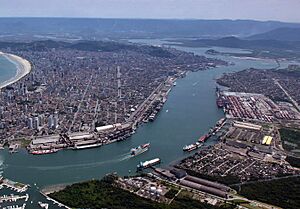
By 2100, coastal flooding and erosion will affect at least 3–4 million people in South America. Many people live in low-lying areas, including 6% of Venezuela's population, 56% of Guyana's, and 68% of Suriname's. In Guyana, much of the capital, Georgetown, is already below sea level.
In Brazil, the coastal area of Caatinga, which produces 99% of its shrimp, is threatened by sea level rise, ocean warming, and ocean acidification. In the Port of Santos, Brazil, storm surges were three times more frequent between 2000 and 2016 than in earlier years.
Europe
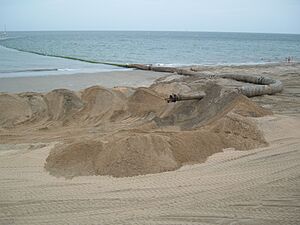
Many sandy coastlines in Europe are vulnerable to erosion from sea level rise. In Spain, the Costa del Maresme could shrink by 16 meters (52 feet) by 2050 and 52 meters (171 feet) by 2100 in a high-emission scenario. Other vulnerable coastlines include parts of Italy, Portugal, and Denmark.
In France, 8,000–10,000 people might have to move away from the coasts by 2080. The Italian city of Venice is very vulnerable to flooding and has already spent $6 billion on a barrier system. A quarter of the German state of Schleswig-Holstein, with over 350,000 people, is low-lying and has always been prone to flooding. They use a mix of hard and soft measures to deal with sea level rise.
In the United Kingdom, sea level could rise by 53 to 115 centimeters (21–45 inches) at the mouth of the River Thames by the end of the century. The UK has detailed plans for managing its coastlines over different time periods.
The Netherlands is a country partly below sea level and sinking. It has expanded its Delta Works program, which includes strengthening dikes and broadening coastal dunes. They plan for a sea level rise of up to 1.3 meters (4.3 feet) by 2100 and 2–4 meters (6.6–13.1 feet) by 2200, with annual spending of €1.0–€1.5 billion.
North America
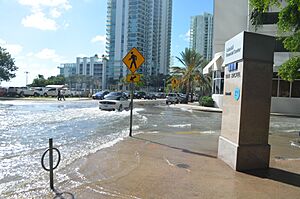
As of 2017, about 95 million Americans lived on the coast, along with 6.5 million in Canada and 19 million in Mexico. Increased "nuisance flooding" (minor flooding that causes problems) and "king tide" flooding are already issues in Florida and the US East Coast. On average, the number of days with tidal flooding in the US doubled between 2000 and 2020. By 2050, this could increase to 25–75 days per year. U.S. coastal cities are using methods like adding sand to beaches and updating building rules.
Along about 15% of the US coastline, groundwater levels are already below sea level, putting freshwater at risk of becoming salty. In Canada, major cities like Halifax and remote communities like Lennox Island are affected. The Mi'kmaq community on Lennox Island is considering moving due to coastal erosion. In Mexico, sea level rise could cause billions of dollars in damage to tourism spots like Cancun. Increased storm surges are also a problem; Hurricane Sandy caused an additional $8 billion in damage due to sea level rise.

By 2050, coastal flooding in the US is likely to increase tenfold. In New York City, a "100-year flood" could happen every 19–68 years by 2050. By 2050, 20 million people in the greater New York City area could be at risk, with many water treatment and power facilities needing to be moved.
By 2100, sea level rise of 0.9 meters (3 feet) and 1.8 meters (5.9 feet) would threaten 4.2 and 13.1 million people in the US, respectively. In California, 2 meters (6.6 feet) of sea level rise could affect 600,000 people and threaten over $150 billion in property. In nine southeastern US states, the same rise could destroy up to 13,000 historical and archaeological sites.
Island Nations
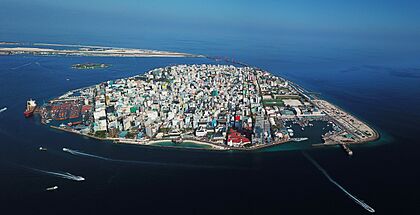
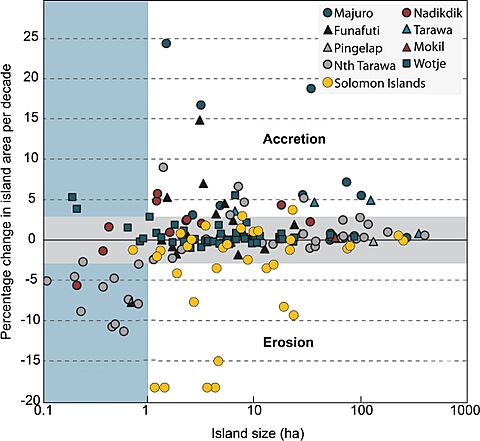
Small island nations, especially those on low-lying atolls, are the most vulnerable to coastal erosion, flooding, and saltwater getting into their soil and freshwater. Sea level rise can make an island unlivable even before it's completely underwater. Children in these states already face problems getting food and water, and experience more stress. At current rates, the Maldives could become unlivable by 2100. Five of the Solomon Islands have already disappeared due to sea level rise and stronger winds.
Adapting to sea level rise is very expensive for small island nations because so many of their people live in risky areas. Countries like the Maldives, Kiribati, and Tuvalu are already considering moving their populations to other countries. In 2014, Kiribati bought land in Fiji to relocate its people when their own islands are lost.
Fiji is also affected but is in a safer position. Its residents are moving inland and restoring coral reefs and mangroves to protect against flooding and erosion, which they see as cheaper than building seawalls. Even if an island isn't completely flooded, tourism and local economies can be destroyed. For example, a 1-meter (3.3 feet) sea level rise could flood or erode 29% of coastal resorts in the Caribbean, with another 49–60% at risk from erosion.
See also
- Coastal development hazards
- Effects of climate change on oceans
- List of countries by average elevation
 | Tommie Smith |
 | Simone Manuel |
 | Shani Davis |
 | Simone Biles |
 | Alice Coachman |


