
Climate of Minnesota facts for kids
Minnesota has a humid continental climate, which means it has hot summers and cold winters. Because Minnesota is in the Upper Midwest of the United States, it experiences a wide variety of weather. Each of its four seasons has its own special features. The area near Lake Superior in the Minnesota Arrowhead region has unique weather. The lake makes the surrounding area cooler in summer and warmer in winter. This gives that region a smaller yearly temperature change. In the Köppen climate classification system, much of southern Minnesota, from the Twin Cities southward, has hot summers. The northern two-thirds of Minnesota has warm summers.
Winter in Minnesota is very cold, with temperatures often below freezing. Snow is the main type of winter precipitation. However, freezing rain, sleet, and sometimes even rain are possible. Common storm systems include Alberta clippers or Panhandle hooks. Some of these can develop into blizzards. Annual snowfall extremes have ranged from over 170 inches (4.3 m) in the rugged Superior Highlands of the North Shore to as little as 5 inches (0.13 m) in southern Minnesota. Temperatures as low as -60 °F (-51 °C) have occurred during Minnesota winters. Spring is a time of major transition in Minnesota. Snowstorms are common early in the spring. But by late spring, as temperatures get milder, the state can experience tornado outbreaks. This risk lessens but does not stop through summer and into autumn.
In summer, heat and humidity are common in the south. Warm and less humid conditions are generally found in the north. These humid conditions cause thunderstorm activity 30–40 days per year. Summer high temperatures in Minnesota average in the mid-80s °F (30 °C) in the south. In the north, they are in the upper-70s °F (25 °C). Temperatures as hot as 114 °F (46 °C) are possible. The growing season in Minnesota varies from 90 days per year in the Iron Range to 160 days in southeastern Minnesota. Tornadoes are possible in Minnesota from March through November or December. The peak tornado month is June, followed by July, May, and August. The state averages 27 tornadoes per year. Average annual precipitation across the state ranges from about 35 inches (890 mm) in the southeast to 20 inches (510 mm) in the northwest. Autumn weather in Minnesota is largely the reverse of spring weather. The jet stream, which tends to weaken in summer, begins to strengthen again. This leads to faster changing weather patterns and more varied temperatures. By late October and November, these storm systems become strong enough to form major winter storms. Autumn and spring are the windiest times of the year in Minnesota.
Contents
Minnesota's Weather: What Makes It Unique?

Because of its location in North America, Minnesota experiences temperature extremes typical of a continental climate. This means cold winters and mild to hot summers in the south, and very cold winters and generally cool summers in the north. Each season has different upper air patterns that bring different weather conditions. The state is nearly 500 miles (800 km) from any large body of water (except Lake Superior). This causes temperatures and precipitation to vary widely. It is far enough north to experience -60 °F (-51 °C) temperatures and blizzards during winter. But it is far enough south to have 114 °F (46 °C) temperatures and tornado outbreaks in summer. The 174 °F (97 °C) difference between Minnesota's highest and lowest temperature is the eleventh largest of any U.S. state. It's the third largest of any state east of the Rocky Mountains.
Minnesota is far from major sources of moisture. It is in the transition zone between the moist East and the semi-arid Great Plains. Annual average precipitation across the state ranges from around 35 inches (890 mm) in the southeast to 20 inches (510 mm) in the northwest. Snow is the main form of precipitation from November through March. Rain is most common the rest of the year. Annual snowfall extremes have ranged from over 170 inches (4.3 m) in the rugged Superior Highlands of the North Shore to as little as 2.3 inches (0.058 m) in southern Minnesota. It has snowed in Minnesota during every month except July. The state averages 110 days per year with snow cover of an inch (2.5 cm) or greater.
How Lake Superior Changes the Weather

Lake Superior moderates the climate of parts of Minnesota's Arrowhead Region near the shore. The lake acts as a heat sink, keeping the state's North Shore area relatively cooler in the summer and warmer in the winter. While this effect is strong near the lake, it does not reach very far inland. For example, Grand Marais on the lakeshore has an average July high temperature of 70 °F (21 °C). Meanwhile, Virginia, at about the same latitude but inland about 100 miles (160 km) to the west, has an average July high of 77 °F (25 °C). Virginia's average high temperature in January is 15 °F (-9 °C), while Grand Marais’ is 23 °F (-5 °C). Just a few miles inland from Lake Superior are the Sawtooth Mountains. These mountains almost completely keep the lake's air masses and associated precipitation to lower elevations near the lake.
The usual northwest winter winds also limit the lake's influence. Places near the shoreline can receive lake-effect snow. But because the state lies north and west of the lake, snowfall amounts are not nearly as large as in locations like Wisconsin and Michigan that lie downwind to the south. Even so, the single largest snowstorm in Minnesota history was a lake effect event. On January 6, 1994, Finland, Minnesota, received 36 inches (0.91 m) of lake effect snow in 24 hours, and 47 inches (1.2 m) over a three-day period. Both are Minnesota records. At 85 inches (2.2 m) per year, the port city of Duluth has the highest average snowfall total of any city in Minnesota. At 58.9 °F (14.9 °C), Grand Marais has the lowest average summer temperature of any city in the state.
The climate effects of Lake Superior tend to stop convection, which limits the potential for tornadoes. Although Cook and Lake counties are two of the largest counties in the state, they have experienced only seven tornadoes in the past 56 years. One of those tornadoes was a large F3 that occurred in the Tornado outbreak of August 6, 1969.
Temperature and Precipitation in Minnesota
Average Temperatures in Minnesota
| Jan | Feb | Mar | Apr | May | Jun | Jul | Aug | Sept | Oct | Nov | Dec | Annual | |
|---|---|---|---|---|---|---|---|---|---|---|---|---|---|
| Alexandria | 8 (−13) |
15 (−9) |
27 (−3) |
43 (6) |
56 (13) |
65 (18) |
70 (21) |
68 (20) |
58 (14) |
45 (7) |
28 (−2) |
14 (−10) |
41 (5) |
| Brainerd | 6 (−14) |
13 (−11) |
26 (−3) |
42 (6) |
56 (13) |
64 (18) |
69 (21) |
66 (19) |
56 (13) |
44 (7) |
28 (−2) |
13 (−11) |
40 (4) |
| Duluth | 10 (−12) |
17 (−8) |
26 (−3) |
39 (4) |
48 (9) |
58 (14) |
66 (19) |
65 (18) |
56 (13) |
45 (7) |
31 (−1) |
17 (−8) |
40 (4) |
| Grand Marais | 14 (−10) |
19 (−7) |
28 (−2) |
38 (3) |
47 (8) |
53 (12) |
61 (16) |
63 (17) |
55 (13) |
45 (7) |
32 (0) |
19 (−7) |
39 (4) |
| International Falls | 3 (−16) |
11 (−12) |
24 (−4) |
39 (4) |
53 (12) |
62 (17) |
66 (19) |
64 (18) |
53 (12) |
42 (6) |
24 (−4) |
9 (−13) |
38 (3) |
| Redwood Falls | 13 (−11) |
20 (−7) |
32 (0) |
47 (8) |
60 (16) |
70 (21) |
74 (23) |
71 (22) |
62 (17) |
49 (9) |
32 (0) |
18 (−8) |
46 (8) |
| Thief River Falls | 3 (−16) |
11 (−12) |
24 (−4) |
42 (6) |
56 (13) |
64 (18) |
69 (21) |
67 (19) |
56 (13) |
44 (7) |
24 (−4) |
9 (−13) |
39 (4) |
| Twin Cities | 13 (−11) |
20 (−7) |
32 (0) |
47 (8) |
59 (15) |
68 (20) |
73 (23) |
71 (22) |
61 (16) |
49 (9) |
32 (0) |
19 (−7) |
45 (7) |
| Winona | 18 (−8) |
24 (−4) |
36 (2) |
50 (10) |
62 (17) |
71 (22) |
76 (24) |
73 (23) |
64 (18) |
52 (11) |
32 (0) |
23 (−5) |
49 (9) |
| Worthington | 11 (−12) |
18 (−8) |
29 (−2) |
44 (7) |
57 (14) |
67 (19) |
71 (22) |
68 (20) |
59 (15) |
47 (8) |
30 (−1) |
17 (−8) |
43 (6) |
Average Rainfall in Minnesota
| Jan | Feb | Mar | Apr | May | Jun | Jul | Aug | Sept | Oct | Nov | Dec | Annual | |
|---|---|---|---|---|---|---|---|---|---|---|---|---|---|
| Alexandria | 1.0 (25) | 0.7 (18) | 1.5 (38) | 3.0 (76) | 4.5 (110) | 3.3 (84) | 3.6 (91) | 2.7 (69) | 2.2 (56) | 1.2 (30) | 0.6 (15) | 26.0 (660) | |
| Brainerd | 0.8 (20) | 0.6 (15) | 1.5 (38) | 2.0 (51) | 3.3 (84) | 4.2 (110) | 4.1 (100) | 3.6 (91) | 2.8 (71) | 2.5 (64) | 1.6 (41) | 0.7 (18) | 27.7 (700) |
| Duluth | 1.0 (25) | 0.5 (13) | 1.4 (36) | 1.6 (41) | 2.3 (58) | 3.7 (94) | 3.7 (94) | 3.7 (94) | 3.7 (94) | 1.9 (48) | 1.4 (36) | 0.8 (20) | 25.6 (650) |
| Grand Marais | 0.7 (18) | 0.6 (15) | 1.1 (28) | 1.3 (33) | 2.5 (64) | 3.4 (86) | 3.4 (86) | 3.1 (79) | 3.4 (86) | 2.6 (66) | 1.8 (46) | 0.8 (20) | 24.6 (620) |
| International Falls | 0.8 (20) | 0.6 (15) | 1.0 (25) | 1.4 (36) | 2.6 (66) | 4.0 (100) | 3.4 (86) | 3.1 (79) | 3.0 (76) | 2.0 (51) | 1.4 (36) | 0.7 (18) | 23.9 (610) |
| Redwood Falls | 0.7 (18) | 0.6 (15) | 1.7 (43) | 2.5 (64) | 3.1 (79) | 4.1 (100) | 3.8 (97) | 3.6 (91) | 2.5 (64) | 1.9 (48) | 1.6 (41) | 0.6 (15) | 26.6 (680) |
| Thief River Falls | 0.2 (5.1) | 0.3 (7.6) | 0.4 (10) | 1.0 (25) | 2.6 (66) | 3.4 (86) | 3.4 (86) | 3.1 (79) | 2.4 (61) | 1.7 (43) | 0.9 (23) | 0.3 (7.6) | 19.7 (500) |
| Twin Cities | 1.0 (25) | 0.8 (20) | 1.9 (48) | 2.3 (58) | 3.2 (81) | 4.3 (110) | 4.1 (100) | 4.1 (100) | 2.7 (69) | 2.1 (53) | 1.9 (48) | 1.0 (25) | 29.4 (750) |
| Winona | 1.4 (36) | 0.7 (18) | 1.8 (46) | 3.5 (89) | 3.9 (99) | 4.2 (110) | 4.4 (110) | 4.7 (120) | 3.9 (99) | 2.2 (56) | 2.2 (56) | 1.3 (33) | 34.2 (870) |
| Worthington | 0.7 (18) | 0.6 (15) | 1.9 (48) | 2.7 (69) | 3.4 (86) | 4.6 (120) | 3.6 (91) | 3.5 (89) | 2.6 (66) | 2.0 (51) | 1.7 (43) | 0.7 (18) | 27.8 (710) |
| Climate data for Duluth Int'l, Minnesota (1991–2020 normals, extremes 1871–present ) | |||||||||||||
|---|---|---|---|---|---|---|---|---|---|---|---|---|---|
| Month | Jan | Feb | Mar | Apr | May | Jun | Jul | Aug | Sep | Oct | Nov | Dec | Year |
| Record high °F (°C) | 55 (13) |
58 (14) |
81 (27) |
88 (31) |
95 (35) |
97 (36) |
106 (41) |
97 (36) |
95 (35) |
86 (30) |
75 (24) |
56 (13) |
106 (41) |
| Mean maximum °F (°C) | 39 (4) |
43 (6) |
56 (13) |
71 (22) |
82 (28) |
86 (30) |
89 (32) |
87 (31) |
82 (28) |
74 (23) |
55 (13) |
40 (4) |
90 (32) |
| Mean daily maximum °F (°C) | 19.9 (−6.7) |
24.8 (−4.0) |
36.2 (2.3) |
49.2 (9.6) |
63.0 (17.2) |
72.1 (22.3) |
77.7 (25.4) |
75.8 (24.3) |
67.2 (19.6) |
52.7 (11.5) |
37.1 (2.8) |
24.7 (−4.1) |
50.0 (10.0) |
| Daily mean °F (°C) | 11.2 (−11.6) |
15.4 (−9.2) |
27.0 (−2.8) |
39.5 (4.2) |
52.0 (11.1) |
61.2 (16.2) |
67.0 (19.4) |
65.5 (18.6) |
57.2 (14.0) |
44.1 (6.7) |
29.8 (−1.2) |
17.1 (−8.3) |
40.6 (4.8) |
| Mean daily minimum °F (°C) | 2.4 (−16.4) |
6.0 (−14.4) |
17.8 (−7.9) |
29.9 (−1.2) |
41.0 (5.0) |
50.2 (10.1) |
56.2 (13.4) |
55.2 (12.9) |
47.3 (8.5) |
35.6 (2.0) |
22.5 (−5.3) |
9.6 (−12.4) |
31.1 (−0.5) |
| Mean minimum °F (°C) | −22 (−30) |
−17 (−27) |
−7 (−22) |
15 (−9) |
29 (−2) |
38 (3) |
46 (8) |
45 (7) |
33 (1) |
22 (−6) |
3 (−16) |
−14 (−26) |
−24 (−31) |
| Record low °F (°C) | −41 (−41) |
−39 (−39) |
−29 (−34) |
−5 (−21) |
16 (−9) |
27 (−3) |
35 (2) |
32 (0) |
23 (−5) |
6 (−14) |
−29 (−34) |
−35 (−37) |
−41 (−41) |
| Average precipitation inches (mm) | 0.95 (24) |
1.01 (26) |
1.46 (37) |
2.53 (64) |
3.37 (86) |
4.39 (112) |
3.92 (100) |
3.73 (95) |
3.48 (88) |
2.91 (74) |
1.96 (50) |
1.47 (37) |
31.18 (792) |
| Average snowfall inches (cm) | 16.8 (43) |
15.1 (38) |
12.8 (33) |
9.1 (23) |
0.8 (2.0) |
0.0 (0.0) |
0.0 (0.0) |
0.0 (0.0) |
0.1 (0.25) |
2.7 (6.9) |
14.1 (36) |
18.7 (47) |
90.2 (229) |
| Average precipitation days (≥ 0.01 in) | 10.4 | 8.9 | 9.6 | 11.3 | 12.7 | 12.4 | 11.9 | 10.8 | 11.6 | 11.9 | 11.0 | 10.7 | 133.2 |
| Average snowy days (≥ 0.1 in) | 13.1 | 10.9 | 8.0 | 5.7 | 0.6 | 0.0 | 0.0 | 0.0 | 0.1 | 2.1 | 9.0 | 12.9 | 62.4 |
| Average relative humidity (%) | 72.0 | 69.8 | 69.3 | 63.6 | 62.7 | 69.5 | 70.9 | 74.5 | 75.7 | 71.4 | 74.9 | 76.3 | 70.9 |
| Average dew point °F (°C) | 0.3 (−17.6) |
4.5 (−15.3) |
15.4 (−9.2) |
25.5 (−3.6) |
36.5 (2.5) |
48.2 (9.0) |
55.0 (12.8) |
54.0 (12.2) |
45.7 (7.6) |
34.0 (1.1) |
21.2 (−6.0) |
7.2 (−13.8) |
29.0 (−1.7) |
| Mean monthly sunshine hours | 132.7 | 149.7 | 190.7 | 229.5 | 263.5 | 272.8 | 307.5 | 261.8 | 194.0 | 150.4 | 98.5 | 102.3 | 2,353.4 |
| Percent possible sunshine | 47 | 52 | 52 | 56 | 57 | 58 | 64 | 60 | 51 | 44 | 35 | 38 | 53 |
| Source: NOAA (relative humidity, dew point, and sun 1961–1990) | |||||||||||||
| Climate data for Minneapolis–Saint Paul International Airport, Minnesota (1991–2020 normals, extremes 1872–present) | |||||||||||||
|---|---|---|---|---|---|---|---|---|---|---|---|---|---|
| Month | Jan | Feb | Mar | Apr | May | Jun | Jul | Aug | Sep | Oct | Nov | Dec | Year |
| Record high °F (°C) | 58 (14) |
65 (18) |
83 (28) |
95 (35) |
106 (41) |
104 (40) |
108 (42) |
103 (39) |
104 (40) |
92 (33) |
77 (25) |
68 (20) |
108 (42) |
| Mean maximum °F (°C) | 42.5 (5.8) |
46.7 (8.2) |
64.7 (18.2) |
79.7 (26.5) |
88.7 (31.5) |
93.3 (34.1) |
94.4 (34.7) |
91.7 (33.2) |
88.3 (31.3) |
80.1 (26.7) |
62.1 (16.7) |
47.1 (8.4) |
96.4 (35.8) |
| Mean daily maximum °F (°C) | 23.6 (−4.7) |
28.5 (−1.9) |
41.7 (5.4) |
56.6 (13.7) |
69.2 (20.7) |
79.0 (26.1) |
83.4 (28.6) |
80.7 (27.1) |
72.9 (22.7) |
58.1 (14.5) |
41.9 (5.5) |
28.8 (−1.8) |
55.4 (13.0) |
| Daily mean °F (°C) | 16.2 (−8.8) |
20.6 (−6.3) |
33.3 (0.7) |
47.1 (8.4) |
59.5 (15.3) |
69.7 (20.9) |
74.3 (23.5) |
71.8 (22.1) |
63.5 (17.5) |
49.5 (9.7) |
34.8 (1.6) |
22.0 (−5.6) |
46.9 (8.3) |
| Mean daily minimum °F (°C) | 8.8 (−12.9) |
12.7 (−10.7) |
24.9 (−3.9) |
37.5 (3.1) |
49.9 (9.9) |
60.4 (15.8) |
65.3 (18.5) |
62.8 (17.1) |
54.2 (12.3) |
40.9 (4.9) |
27.7 (−2.4) |
15.2 (−9.3) |
38.4 (3.6) |
| Mean minimum °F (°C) | −14.7 (−25.9) |
−8 (−22) |
2.7 (−16.3) |
21.9 (−5.6) |
35.7 (2.1) |
47.3 (8.5) |
54.5 (12.5) |
52.3 (11.3) |
38.2 (3.4) |
26.0 (−3.3) |
9.2 (−12.7) |
−7.1 (−21.7) |
−16.9 (−27.2) |
| Record low °F (°C) | −41 (−41) |
−33 (−36) |
−32 (−36) |
2 (−17) |
18 (−8) |
34 (1) |
43 (6) |
39 (4) |
26 (−3) |
10 (−12) |
−25 (−32) |
−39 (−39) |
−41 (−41) |
| Average precipitation inches (mm) | 0.89 (23) |
0.87 (22) |
1.68 (43) |
2.91 (74) |
3.91 (99) |
4.58 (116) |
4.06 (103) |
4.34 (110) |
3.02 (77) |
2.58 (66) |
1.61 (41) |
1.17 (30) |
31.62 (803) |
| Average snowfall inches (cm) | 11.0 (28) |
9.5 (24) |
8.2 (21) |
3.5 (8.9) |
0.0 (0.0) |
0.0 (0.0) |
0.0 (0.0) |
0.0 (0.0) |
0.0 (0.0) |
0.8 (2.0) |
6.8 (17) |
11.4 (29) |
51.2 (130) |
| Average extreme snow depth inches (cm) | 8 (20) |
9 (23) |
8 (20) |
2 (5.1) |
0 (0) |
0 (0) |
0 (0) |
0 (0) |
0 (0) |
0 (0) |
4 (10) |
7 (18) |
9 (23) |
| Average precipitation days (≥ 0.01 in) | 9.6 | 7.8 | 9.0 | 11.2 | 12.4 | 11.8 | 10.4 | 9.8 | 9.3 | 9.5 | 8.3 | 9.7 | 118.8 |
| Average snowy days (≥ 0.1 in) | 9.3 | 7.3 | 5.2 | 2.4 | 0.1 | 0.0 | 0.0 | 0.0 | 0.0 | 0.6 | 4.5 | 8.8 | 38.2 |
| Average relative humidity (%) | 69.9 | 69.5 | 67.4 | 60.3 | 60.4 | 63.8 | 64.8 | 67.9 | 70.7 | 68.3 | 72.6 | 74.1 | 67.5 |
| Average dew point °F (°C) | 4.1 (−15.5) |
9.5 (−12.5) |
20.7 (−6.3) |
31.6 (−0.2) |
43.5 (6.4) |
54.7 (12.6) |
60.1 (15.6) |
58.3 (14.6) |
49.8 (9.9) |
37.9 (3.3) |
25.0 (−3.9) |
11.1 (−11.6) |
33.9 (1.0) |
| Mean monthly sunshine hours | 156.7 | 178.3 | 217.5 | 242.1 | 295.2 | 321.9 | 350.5 | 307.2 | 233.2 | 181.0 | 112.8 | 114.3 | 2,710.7 |
| Percent possible sunshine | 55 | 61 | 59 | 60 | 64 | 69 | 74 | 71 | 62 | 53 | 39 | 42 | 59 |
| Average ultraviolet index | 1 | 2 | 3 | 5 | 7 | 8 | 8 | 7 | 5 | 3 | 2 | 1 | 4 |
| Source 1: NOAA (relative humidity, dew point and sun 1961–1990) | |||||||||||||
| Source 2: Weather Atlas (UV) | |||||||||||||
The Four Seasons of Minnesota
Winter: The Cold and Snowy Season

Even though winter does not officially start until late December, Minnesota usually begins experiencing winter-like conditions in November, sometimes in October. As with many other Midwestern states, winter in Minnesota is characterized by cold (below freezing) temperatures and snowfall. Weather systems can move in from the north, west, or south, with most weather coming from the north. A vigorous jet stream brings high and low-pressure systems through quickly. This can cause large temperature variations over a short period.
How Cold Does Minnesota Get in Winter?
As the last remnants of summertime air in the southern U.S. start to lose their grip, cold polar air building up in northern Canada starts to push farther south, eventually spreading into Minnesota. By December and January, Minnesota is fully covered in polar air and is then subjected to outbreaks of arctic air masses. Because there are no natural barriers north or northwest of Minnesota to block arctic air from pouring south, Minnesota gets regular blasts of arctic air through the winter. High pressure systems that move south from the Canadian plains behind the fronts bring light winds, clear skies, and bitterly cold temperatures. The northern part of Minnesota gets the brunt of the cold air. International Falls, sometimes called the "Icebox of the nation," has the coldest average annual temperature of any National Weather Service first-order station in the contiguous United States at 37.4 °F (3.0 °C). Tower, Minnesota, sinks below 0 °F (-18 °C) on an average of seventy-one days per year. The ten coldest counties in the contiguous US, based on January minimums, are all located in Minnesota. The air mass then slowly moderates as it moves south into the rest of the state. Alberta clippers alternate with these high-pressure systems, bringing high winds and some snowfall.

Minnesota occasionally gets breaks from the polar and arctic air when a zonal flow takes hold. This means the jet stream will move in a west to east motion—rather than north to south—and warmer air from the western United States is pushed into the region. In Minnesota, this pattern commonly leads to a prolonged period of above-freezing high temperatures that gives Minnesotans a break from the winter freeze. Storms that move into Minnesota from a more westerly direction generally do not bring significant amounts of precipitation. This pattern becomes especially common when El Niño is present, as the jet stream is weakened and pushed further north into Canada. Therefore, arctic air is often blocked from entering Minnesota. The opposite phase, La Niña, amplifies the jet stream, so arctic air intrusions become even colder and more prevalent.
Snow and Ice: Winter Precipitation
Winter precipitation comes in a few different forms. Snow is the main form of precipitation. But freezing rain, ice, sleet, and sometimes even rain are all possible during the winter months. Larger storm systems, often Panhandle hooks or other storms that occur with a meridional flow, can bring large amounts of snow and even blizzard conditions.
What are Alberta Clippers?

Alberta clippers are fast-moving areas of low pressure that move through Minnesota during the winter months. Clippers get their name from Alberta, Canada, the province from which they begin their southward track. Although clippers often originate over the northern Pacific Ocean, they lose most of their moisture through orographic lift when they collide with the Canadian Rockies. Because of the limited moisture content and quick movement of the systems, clippers rarely produce more than 6 inches (0.15 m) of snow as they pass through Minnesota. The biggest effects of an Alberta Clipper are what follows them: arctic air, high wind speed, and dangerous wind chills. This often results in severe blowing and drifting snow, and sometimes even blizzard conditions. Alberta Clippers often proceed to become copious lake-effect snow producers on the southern and eastern shores of the Great Lakes.
What are Panhandle Hooks?
In terms of their characteristics, Panhandle hooks are nearly the opposite of Alberta clippers. Instead of forming in the north and dropping south, these low-pressure systems form in the southwestern United States and then move northeast. They get their name from the location where they usually make their turn to the north: near the panhandles of Oklahoma and Texas. Unlike clippers, these storms usually have a great deal of moisture. As the storms make their turn to the north, they pull in moist air from the nearby Gulf of Mexico and pull it northward toward Minnesota and other parts of the Midwest. As these systems move to the northeast, there will usually be a heavy band of snow to the northwest of the low-pressure center if there is enough cold air present. A wintery mix of precipitation, rain, or sometimes even thunderstorms will then often occur to the south of it. Snowfall of over a foot (30 cm) is not uncommon with a panhandle hook. Because of the high moisture content in these systems, the snow is usually wet and heavy. Large panhandle hooks can become powerful enough to draw in arctic air after they pass by the state, leaving bitter cold temperatures and wind chills in their wake. Panhandle Hooks are responsible for some of the most famous blizzards that have occurred in the Midwest, including the blizzard of November 1940 and the Great Storm of 1975.
Spring: A Time of Change

Spring is a time of major transition in Minnesota. As winter nears its end, the sun rises higher in the sky and temperatures begin to moderate. As this happens, much of the Midwest starts to experience severe thunderstorms and tornadoes. Storm systems that move inland from the Pacific begin to collide with the increasingly warm and moist air from the Gulf of Mexico. In the early part of the spring, Minnesota is usually not in a geographically favorable position to experience severe weather since the warm air needed for it has not yet pushed that far to the north. Early spring tornado outbreaks do occur occasionally in Minnesota though, as shown by the 1998 Comfrey – St. Peter tornado outbreak on March 29, 1998. More often, Minnesota is on the northern (cooler) side of major storm systems in the early spring, which instead results in only rain and possibly snow. Even though the winter snow pack typically starts to melt in southern Minnesota in early March, there is usually still enough cold air present over Canada to allow for major snow storms in Minnesota until late April. Very heavy (30+ inches or 76+ cm) monthly snowfalls can occur in March, such as in 1951 and 1965. Rarely, they occur in April, such as in April 2002 when over 20 inches (51 cm) of snow fell at Minneapolis, and April 2013, when heavy snow covered Minnesota and Duluth received a record monthly snowfall (for any month) of over 50 inches (1.3 m).

As spring progresses, the jet stream starts to push storm systems farther to the north. Southern Minnesota then becomes more prone to severe thunderstorms and tornadoes. As spring moves into the later stages, the chances for snow continue to drop and eventually disappear, from south to north. By the time it gets warm enough for severe weather in northern Minnesota, the strength of storm systems has usually started to decrease. This results in fewer severe storms in northern Minnesota compared to the southern part of the state.
Windy Days in Minnesota
With the exception of areas along the shores of Lake Superior, winds in Minnesota generally prevail from the north and northwest in the winter, and south and southeast in the summer. On average, autumn and spring are the windiest times of the year in Minnesota. October is the windiest month in northwest Minnesota, while April is the windiest over the rest of the state. Winds generally average between 9 and 11 mph (14 and 18 km/h) across the state, with one major exception. The heaviest winds in the state are found on the Buffalo Ridge, or Coteau des Prairies. This is a flatiron-shaped area extending from Watertown, South Dakota, diagonally across southwestern Minnesota and into Iowa. Created by two lobes of a glacier parting around a pre-existing plateau during the (Pleistocene) Ice Age, the Buffalo Ridge is ideal for wind power generation, with average wind speeds of 16.1 mph (26.8 km/h).
Flooding in Minnesota Rivers

Minnesota is prone to flooding in its major rivers by spring snowmelt runoff and ice jams. Spring flooding to some degree occurs almost annually on some Minnesota rivers. But major floods have occurred in 1965, 1969, 1997, 2001, and 2009. The flooding in 1965 was the worst flood in Minnesota history on the Mississippi River. The flooding in 1997 was the worst in history on the Red River. The Red River flood of 1997 was made much worse by the 11 blizzards that struck Minnesota that winter. Besides heavy winter and spring snowfall, cold winter temperatures and heavy autumn and spring rains causing sudden run-off surges are also common causes of spring river flooding in Minnesota.
Minnesota is also prone to both river flooding and localized flash flooding by extended periods of heavy late-spring and summer rainfall. The Great Flood of 1993 on the Mississippi River was caused by copious amounts of rain that fell after the spring snow melt. The 2007 Midwest flooding, which affected the hilly Driftless area of southeast Minnesota, was the result of a training pattern of storms mixing warm moist air from Tropical Storm Erin with cooler Canadian air. This resulted in record 24-hour rainfall totals of up to 17 inches (430 mm). A similar flooding event occurred in 2010 as a result of the remnants of tropical storm Georgette in the eastern Pacific and Hurricane Karl in the Gulf of Mexico.
Summer: Warmth and Thunderstorms

During a Minnesota summer, heat and humidity are common in the south. Warm and less humid conditions are generally present in the north. A main feature of summer weather in Minnesota and the Midwestern United States as a whole is the weakening of the jet stream. This leads to slower movement of air masses, a general increase in the stability of temperatures, and less wind. The strong wind that does blow almost always comes from the south, bringing in warm temperatures and humidity. These humid conditions and a jet stream that has pushed into the northern parts of the U.S. cause thunderstorm activity 30–40 days per year.
Summer Temperatures in Minnesota

Daily average summer temperatures in Minnesota range from the low 70s °F (22 °C) in the south to the mid-60s °F (19 °C) in the north. Because summer time air masses are not as volatile as in the winter, daily high and low temperatures rarely vary more than 15 degrees (7 °C) either side of normal. While summertime around much of the country means long stretches of hot and humid weather, Minnesota is located far enough north where periods of cooler, drier polar air frequently move in behind polar fronts dropping south from Canada. The polar air typically does not linger very long, however, and is quickly replaced by the warmer and more humid air from the Gulf of Mexico again. The cool, dry polar air colliding with hot and humid summertime air keep the threat of thunderstorms and tornadoes in Minnesota through July and August. Northern Minnesota is considerably cooler and less humid than southern Minnesota during the summer months. For example, Duluth's annual average temperature and dew point are 6 degrees (3.4 °C) cooler than Minneapolis'.
July is the hottest month in Minnesota statewide and is usually the month when the peak heat waves occur. In July 1936, Minnesota and the rest of the Midwest suffered through its most severe heat wave on record. Most of the state was engulfed in 100 °F (38 °C) temperatures for several days in a row. Minnesota's all-time record high temperature of 114 °F (46 °C) was equaled during this stretch. This heat wave was also responsible for the Twin Cities' all-time record high of 108 °F (42 °C), as well as the all-time record high of several other cities across the state.
The western region of Minnesota experiences the hottest summer temperatures. Coteau des Prairies can heat cities to the north of it similar to how places in the Rocky Mountains are warmed by Chinook winds. As southwest winds blow down the slope of Coteau des Prairies, the air compresses and warms. This heats the hot air even further and often brings locations such as Beardsley and Moorhead the hottest temperatures in the state, despite their higher latitudes.
Summer Rain and Storms

The summer months of June, July, August, and September account for nearly half of the annual precipitation total across the state of Minnesota. Most of this rain falls from thunderstorms, a frequent summer occurrence. Even though summer is the primary season for Minnesota to experience thunderstorms, they can occur from March to November. These storms can become severe, producing large hail, strong tornadoes, and large bow echos that result in damaging straight-line winds. Minnesota has experienced several major derecho events, most recently the Boundary Waters-Canadian Derecho which blew down millions of trees in the Boundary Waters Canoe Area Wilderness on July 4, 1999.
Summertime thunderstorms are fueled by dew points that often reach beyond 70 °F (21 °C) and sometimes even 80 °F (27 °C). In addition to severe conditions, thunderstorms produce heavy rain and cloud to ground lightning. Heavy rain brings flash floods to Minnesota an average of three days per year. With the exception of hail, summer precipitation in Minnesota is almost always in the form of rain. The lone exception is in far northern Minnesota, where in mid-September, small amounts of snow become a possibility.
Droughts and Forest Fires

Droughts are an annual summer concern in Minnesota, especially for farmers. The growing season (which varies from 90 days per year in the Iron Range to 160 days in southeast Minnesota) is when Minnesota averages its highest percentage of annual precipitation. So, a lack of rainfall during this time period can be devastating to crops. The last major drought in Minnesota was in 1988. During that year, the period of April to July was the second-driest in the previous century, and the period of May to August was the hottest on record. The combination of dry skies and heat caused a severe drought which cost the state approximately 1.2 billion dollars in crop losses.
Other memorable drought years were 1976 and the Dust Bowl years of the 1930s. During the Dust Bowl, inappropriate farming techniques enhanced by years of drought conditions led to dust storms in Southern Minnesota and the other parts of the Midwest. Drought conditions also have helped spawn forest fires. In 1894, the Great Hinckley Fire destroyed Hinckley killing an estimated 459 people. In 1918, a forest fire killed 453 people in the vicinity of Cloquet. More recently, in 2006, the Cavity Lake Fire burned 31,830 acres (129 km2) in the Boundary Waters Canoe Area Wilderness.
Tornadoes in Minnesota

Tornadoes are possible in Minnesota from March–November. But the peak tornado month is June, followed by July, May, and August. Tornadoes are most common in the southern half of the state, which is located on the northern edge of Tornado Alley. Just over a third of tornadoes in Minnesota strike between 4:00 pm and 6:00 pm. The state averages 27 tornadoes per year, 99% of which have ratings of F2 or weaker. On average, Minnesota has an F5 tornado once every 25 years. Some of the notable Minnesota tornadoes and outbreaks are:
- August 21, 1883: An F5 tornado struck Rochester, killing 37. This tornado led to the construction of a new hospital, which eventually evolved into the Mayo Clinic.
- April 14, 1886: A large tornado struck Sauk Rapids, killing 72. This was Minnesota's deadliest tornado on record.
- June 22, 1919: The second-deadliest tornado in Minnesota history tore through Fergus Falls, killing 59.
- May 6, 1965: Four F4 tornadoes ripped through the Twin Cities metro area (two of them in Fridley), killing 13.
- June 16, 1992: Minnesota experienced its second-largest tornado outbreak with 27 recorded twisters. The largest tornado in this family was an F5 that struck Chandler, Minnesota, killing one. This is the most recent F5 tornado to strike the state.
- March 29, 1998: An F4 and an F3 tornado that were part of a larger outbreak tore through the towns of Comfrey and St. Peter. They killed two and caused damage in the millions of dollars in Minnesota's earliest recorded tornado outbreak.
- June 17, 2010: Three EF4 and six EF3 tornadoes were part of 48 twisters that touched down in Minnesota's largest tornado outbreak on record.
Autumn: Getting Ready for Winter

Autumn weather in Minnesota is marked by the rapid decrease of severe thunderstorms, dramatic cooling, and eventually the possibility of blizzards. With summer-time heat still prevalent in the southern U.S. and colder air quickly taking hold in Canada, Minnesota can be affected by wide temperature swings in short periods of time. Because of this, the jet stream, which tends to weaken during the summer months, begins to re-strengthen. This leads to quicker changes in weather patterns and increasingly strong storm systems. As autumn moves on, these storm systems bring with them progressively colder air, eventually changing the rain over snow, generally starting in October in the northern part of the state and November in the south. From September to December, the average temperature in the state falls by approximately 43 °F (23 °C), the largest such temperature swing within any Minnesota season.

By late October and November, atmospheric dynamics are generally in place to allow storm systems to become very intense. In fact, Minnesota's all-time record low pressure was recorded during autumn on October 26, 2010. If these powerful storm systems are able to draw enough cold air southward from Canada, they can evolve into powerful blizzards. Some of Minnesota's most memorable winter storm events have occurred during the middle part of the autumn season. On November 11, 1940, the southeast half of Minnesota was surprised by the Armistice Day Blizzard. Temperatures in the 60s °F (16 °C) on the morning of November 11 dropped into the single digits (below -12 °C) by the morning of November 12, bringing with them 27 inches (0.69 m) of snow and 60 mph (97 km/h) winds. Known deaths in this blizzard reached 154, 49 of them in Minnesota. On October 31, 1991, much of Minnesota was hit by the Halloween Blizzard. A band of snowfall of 24+ inches (60+ cm) fell from the Twin Cities north to Duluth. It was the single largest snowfall ever recorded in many communities across eastern Minnesota.
Minnesota's Climate in Culture
.jpg)
Minnesota's climate has done much to shape the image of the state. Minnesota has a late but intense spring, a summer of water sports, an autumn of brilliantly colored leaves, and a long winter with outdoor sports and activities.
"Summer at the lake" is a Minnesota tradition. Water skiing was invented in Minnesota by Ralph Samuelson. The Minneapolis Aquatennial features a milk carton boat race. Contestants build boats from milk cartons and float them on Minneapolis area lakes. Recognition is based more on colorful and imaginative designs than on actual racing performance.
But while Minnesota's warm summers provide its natives and tourists with a variety of outdoor activities, the state is known for its winters. The state has produced curlers, skiers, and lugers who have competed in the Winter Olympics. It has pioneers who invented the snowmobile, and legions of ice fishing enthusiasts.

The state is also known for enthusiastic ice hockey players, both at the amateur and professional levels. Eveleth, Minnesota, home to the United States Hockey Hall of Fame, boasts of the number of quality players and the contributions of the city (and the rest of the Mesabi Range) to the growth and development of hockey in the United States.
To many outsiders, Minnesota's winters appear to be cold and inhospitable. A World War II newscaster, in describing the brutally cold conditions of the Russian front, stated that at least Minnesotans could understand it. A New York journalist visited St. Paul and declared that the city was "another Siberia, unfit for human habitation." In response, the city decided to build a huge ice palace in 1886, similar to one that Montreal had built in 1885. They hired the architects of the Canadian ice palace to design one for St. Paul and built a palace 106 feet (32.3 m) high with ice blocks cut from a nearby lake. This began the tradition of the Saint Paul Winter Carnival, a ten-day festival which celebrates Minnesota's winter season.
Minnesota's winters are the setting of several television programs and Hollywood films, including the 1996 film Fargo which features the backdrop of a Minnesota winter. But like most of the characters in the movie, the climate is portrayed as bleak and inhospitable.
Images for kids
-
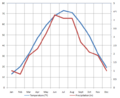
The average monthly temperature of Minneapolis varies from 13 °F (-11 °C) in January to 73 °F (23 °C) in July.
-
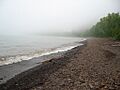
The cool air near Lake Superior makes fog a frequent occurrence near the shore.
-
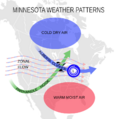
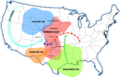
Typical winter storm tracks in Minnesota.
-
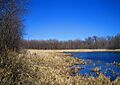
A Minnesota wetland in April.
-

Wind turbines in western Minnesota.
-
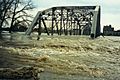
A bridge connecting East Grand Forks, Minnesota, to Grand Forks, North Dakota, during the record flooding of the Red River in 1997.
-

Canoes ready for use on a summer afternoon at Lake Harriet in Minneapolis.
-

Showy ladyslippers bloom during the summer in Voyageurs National Park.
-

A flash flood in Rochester during the 2007 Midwest flooding.
-
Southern Minnesota is located on the edge of Tornado Alley.
-
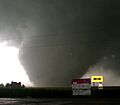
An F3 tornado in southern Minnesota on August 24, 2006.
-
Early autumn in Voyageurs National Park.
-

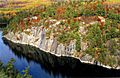
Blue skies and bright leaves during a Minnesota autumn.
-

The ice castle at the 2004 St. Paul Winter Carnival.
-
Ice fishing in Minnesota has been a theme in Hollywood films.
