Iowa facts for kids
Quick facts for kids
Iowa
Ayúȟwa (Lakota)
|
|||
|---|---|---|---|
| State of Iowa | |||
|
|||
| Nickname(s):
Hawkeye State
|
|||
| Motto(s):
Our liberties we prize and our rights we will maintain
|
|||
| Anthem: "The Song of Iowa" |
|||
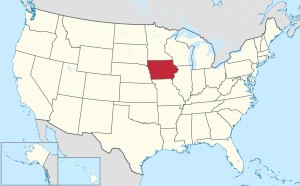
Location of Iowa within the United States
|
|||
| Country | United States | ||
| Admitted to the Union | December 28, 1846 (29th) | ||
| Capital (and largest city) |
Des Moines | ||
| Largest county or equivalent | Polk | ||
| Largest metro and urban areas |
|
||
| Legislature | General Assembly | ||
| • Upper house | Senate | ||
| • Lower house | House of Representatives | ||
| Judiciary | Iowa Supreme Court | ||
| U.S. senators | Chuck Grassley (R) Joni Ernst (R) |
||
| U.S. House delegation | 1: Mariannette Miller-Meeks (R) 2: Ashley Hinson (R) 3: Zach Nunn (R) 4: Randy Feenstra (R) (list) |
||
| Area | |||
| • Total | 56,273 sq mi (145,746 km2) | ||
| • Land | 55,857 sq mi (144,669 km2) | ||
| • Water | 416 sq mi (1,077 km2) 0.70% | ||
| Area rank | 26th | ||
| Highest elevation
(Hawkeye Point)
|
1,670 ft (509 m) | ||
| Population
(2024)
|
|||
| • Total | |||
| • Rank | 32nd | ||
| • Density | 57.1/sq mi (22.1/km2) | ||
| • Density rank | 36th | ||
| • Median household income | $71,400 (2023) | ||
| • Income rank | 30th | ||
| Demonym(s) | Iowan | ||
| Language | |||
| • Official language | English | ||
| Time zone | UTC−06:00 (Central) | ||
| • Summer (DST) | UTC−05:00 (CDT) | ||
| USPS abbreviation |
IA
|
||
| ISO 3166 code | US-IA | ||
| Bird | Eastern goldfinch |
|---|---|
| Flower | Prairie rose |
| Tree | Bur Oak |
Iowa (![]() i/ˈaɪ.əwə/ eye-Ə-wə) is a state in the Midwestern United States. It's bordered by the Mississippi River to the east and the Missouri River to the west. Iowa shares borders with Wisconsin, Illinois, Missouri, Nebraska, South Dakota, and Minnesota.
i/ˈaɪ.əwə/ eye-Ə-wə) is a state in the Midwestern United States. It's bordered by the Mississippi River to the east and the Missouri River to the west. Iowa shares borders with Wisconsin, Illinois, Missouri, Nebraska, South Dakota, and Minnesota.
Iowa is the 26th largest state by total area and the 31st most populated. About 3.19 million people live here, based on the 2020 census. The state's capital and largest city is Des Moines. Part of the larger Omaha, Nebraska, area also reaches into Iowa. Iowa is known as one of the safest U.S. states to live in.
In the 1700s and early 1800s, Iowa was part of French and Spanish Louisiana. The state flag even looks like the flag of France. After the Louisiana Purchase, people started farming, making Iowa a big part of the "Corn Belt."
Later in the 1900s, Iowa's economy changed. It moved from mostly farming to include advanced manufacturing, financial services, and technology. Today, Iowa is also a leader in green energy production. In 2018, there were more than 7 hogs for every person in Iowa!
Contents
- What's in a Name? The Meaning of Iowa
- Iowa's Past: A Look at History
- Iowa's Landscape: Geography and Environment
- How Iowa is Run: Government and Cities
- Who Lives in Iowa? Demographics
- Fun Things to Do: Iowa's Attractions
- Iowa's Economy: How People Make a Living
- Learning in Iowa: Education
- Getting Around: Transportation in Iowa
- Iowa's Way of Life: Culture
- Iowa's Global Friends: Sister Jurisdictions
- See also
What's in a Name? The Meaning of Iowa
Iowa gets its name from the Iowa River. This river was named after the Ioway people, who are an Native American tribe.
The Ioway people are part of the Siouan Nation. They used to be part of the Ho-Chunk Confederation. Before Europeans arrived, the Ioway and other Native American groups lived in the area that is now Iowa.
Iowa's Past: A Look at History
Ancient Times: Iowa's First People

The first people came to Iowa over 13,000 years ago. They were hunters and gatherers living in a cold, icy landscape. Over time, they learned to farm and built complex societies.
During the Archaic period (10,500 to 2,800 years ago), Native Americans settled down more. They started using domesticated plants over 3,000 years ago. The Woodland period saw more farming and the building of mounds.
Later, around 900 AD, people grew more corn. This led to bigger settlements and thriving communities. When Europeans arrived, new diseases and trade goods changed everything. Many Native American tribes lived in Iowa, including the Dakota, Ho-Chunk, Ioway, and Otoe. Other tribes like the Illiniwek, Meskwaki, Omaha, and Sauk also came to Iowa.
Early European Exploration and Trade (1673–1808)
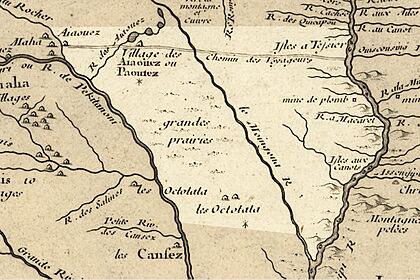
The first Europeans to explore Iowa were Jacques Marquette and Louis Jolliet in 1673. They traveled the Mississippi River and saw Native American villages. France claimed the area, but later gave it to Spain in 1763.
Spain didn't control Iowa very strictly. They let French and British traders set up trading posts. These traders were interested in furs and lead from the Native Americans. The Sauk and Meskwaki tribes controlled much of the trade on the Mississippi River.
In 1800, Napoleon Bonaparte of France took control of Louisiana from Spain. Then, in 1803, the United States bought the Louisiana territory from France. This was called the Louisiana Purchase. Iowa became part of this new U.S. territory. The U.S. built Fort Madison in 1808 to control the region.
Conflicts and U.S. Control (1812–1832)
During the War of 1812, British-supported Native Americans attacked Fort Madison. The fort was defeated in 1813. After the war, the U.S. built new forts to regain control.
The U.S. wanted settlers to move to the east side of the Mississippi River. They also wanted Native Americans to move west. A treaty in 1804 caused problems with the Sauk tribe. This led to the 1832 Black Hawk War.
The Sauk and Meskwaki tribes sold their land in Iowa by 1842. Most moved to a reservation in Kansas. However, many Meskwaki later bought land and returned to Iowa near Tama, Iowa. This Meskwaki Settlement still exists today. Other tribes, like the Ho-Chunk and Dakota, were also forced out of Iowa.
Becoming a State (1832–1860)
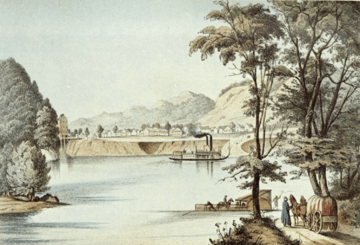
American settlers officially began moving to Iowa in 1833. They came from states like Ohio, Pennsylvania, and New York. They settled along the Mississippi River, founding cities like Dubuque and Bellevue.
On July 4, 1838, Iowa became a U.S. territory. Just a few years later, on December 28, 1846, Iowa officially became the 29th state. After becoming a state, Iowa worked to attract more settlers and investors. They promoted the state's rich farmlands and good government.
Iowa has a long history of state and county fairs. The first Iowa State Fair was held in 1854. Since 1886, the fair has had a permanent home in Des Moines. It has been held every year since then, except for a few times during wars or pandemics.
Iowa and the Civil War (1861–1865)
Iowa strongly supported the Union during the American Civil War. The state voted for Abraham Lincoln. No battles were fought in Iowa itself, but some shots from a battle in Missouri landed in the state.
Iowa sent huge amounts of food to the Union armies. Out of a population of 675,000, Iowa sent over 75,000 volunteers to fight. This was more soldiers, proportionally, than any other state. Many Iowans fought in major campaigns and battles. Twenty-seven Iowans received the Medal of Honor, the highest military award.
Growth and Change (1865–Present)
After the Civil War, Iowa's population grew quickly. The state's economy also changed. Industries began to grow, processing local materials.
The Great Depression and World War II sped up the shift from small farms to larger ones. After World War II, manufacturing grew a lot. In 1975, Iowa welcomed refugees from the Indochina War. Since then, Iowa has continued to accept thousands of refugees from different countries.
In the 1980s, a "farm crisis" caused economic problems in Iowa. This led to a drop in population. However, since the 1990s, Iowa's population has been growing again. Today, Iowa's economy is diverse, with manufacturing, technology, and financial services playing a big role.
Iowa's Landscape: Geography and Environment
Where is Iowa? State Boundaries
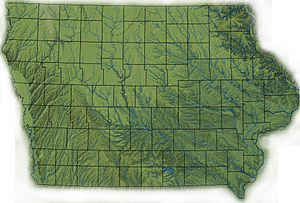
Iowa is unique because its eastern and western borders are almost entirely formed by rivers. The Mississippi River is on the east, and the Missouri River and Big Sioux River are on the west. The northern border is a straight line, and the southern border follows the Des Moines River and another line.
Iowa has 99 counties. However, it has 100 county seats because Lee County has two. The state capital, Des Moines, is in Polk County.
Iowa's Land: Geology and Terrain
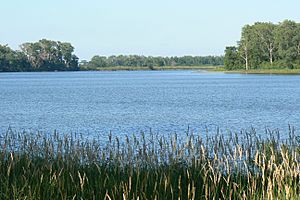
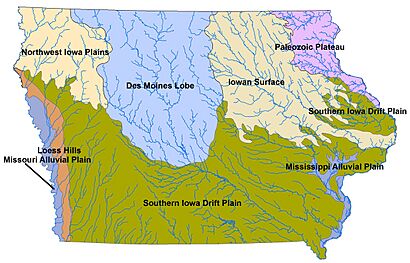
Iowa's land was shaped by glaciers long ago. The state can be divided into eight different landforms. Along the western border are Loess hills, which are made of wind-blown soil and can be very thick. Northeast Iowa is part of the Driftless Area, with steep hills and valleys that look like mountains.
Iowa has some natural lakes, like Spirit Lake and the Iowa Great Lakes in the northwest. There are also man-made lakes, such as Saylorville Lake and Lake Red Rock. Before European settlers arrived, much of Iowa was covered in wetlands, but most of these have been drained.
Nature in Iowa: Ecology and Environment
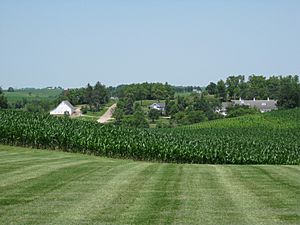
Iowa's natural landscape used to be mostly tallgrass prairie and savanna. There were also thick forests and wetlands along rivers. Today, most of Iowa is used for farming. Crops cover 60% of the state, grasslands cover 30%, and forests cover 7%.
Very little of Iowa's original tallgrass prairie remains. Most of the wetlands and forests are also gone. Iowa ranks low among U.S. states for public land. Some animals and plants in Iowa are endangered or threatened, meaning they are at risk of disappearing.
The large number of livestock farms in Iowa has caused some water pollution and air quality issues. Other environmental concerns include older power plants, fertilizer runoff from farms, and drought. As of early 2024, Iowa has been in a drought for a very long time.
Iowa's Weather: Climate and Precipitation

Iowa has a humid continental climate, which means it has hot summers and cold winters. The average temperature in Des Moines is 50°F (10°C). Snowfall is common in winter.
Spring brings severe weather, including thunderstorms. Iowa averages about 50 thunderstorm days per year. The state also sees many tornadoes, with an average of 47 per year. In 2008, 12 people died from tornadoes in Iowa, making it a very deadly year.
Summers in Iowa are hot and humid, with temperatures often reaching 90°F (32°C) or even over 100°F (38°C). Winters can be very cold, dropping below 0°F (-18°C). The hottest temperature ever recorded in Iowa was 118°F (48°C) in 1934. The coldest was -47°F (-44°C) in 1912.
| City | Jan | Feb | Mar | Apr | May | Jun | Jul | Aug | Sep | Oct | Nov | Dec |
|---|---|---|---|---|---|---|---|---|---|---|---|---|
| Davenport | 30/13 | 36/19 | 48/29 | 61/41 | 72/52 | 81/63 | 85/68 | 83/66 | 76/57 | 65/45 | 48/32 | 35/20 |
| Des Moines | 31/14 | 36/19 | 49/30 | 62/41 | 72/52 | 82/62 | 86/67 | 84/65 | 76/55 | 63/43 | 48/31 | 34/18 |
| Keokuk | 34/17 | 39/21 | 50/30 | 63/42 | 73/52 | 83/62 | 87/67 | 85/65 | 78/56 | 66/44 | 51/33 | 33/21 |
| Mason City | 24/6 | 29/12 | 41/23 | 57/35 | 69/46 | 79/57 | 82/61 | 80/58 | 73/49 | 60/37 | 43/25 | 28/11 |
| Sioux City | 31/10 | 35/15 | 47/26 | 62/37 | 73/49 | 82/59 | 86/63 | 83/63 | 76/51 | 63/38 | 46/25 | 32/13 |
Rain and Snow in Iowa
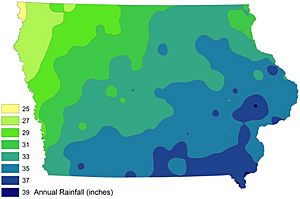
Iowa generally gets more rain in the summer months. The driest months are usually January or February. June is often the wettest month due to frequent thunderstorms. In Des Moines, most of the rain falls from April through September.
How Iowa is Run: Government and Cities
Iowa's Government Structure

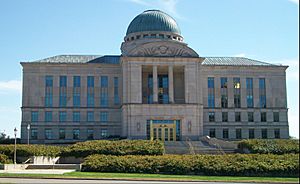
The Governor of Iowa leads the executive branch of the state government. Other important elected officials include the Lieutenant Governor, Secretary of State, and Attorney General.
Iowa's laws are collected in the Code of Iowa. This book is updated regularly by the Iowa Legislative Service Bureau.
Where People Live: Iowa's Cities and Towns
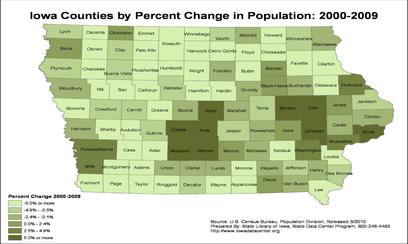
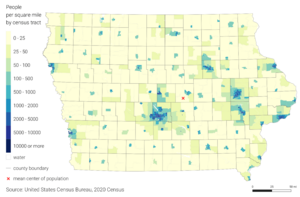
More people in Iowa live in cities than in rural areas. This trend started in the early 1900s. From 2000 to 2008, urban counties grew, while rural counties saw a decline in population.
Some smaller towns, like Denison and Storm Lake, have grown due to new residents. However, Iowa faces a "brain drain" problem. This means that educated young adults sometimes leave the state for better opportunities elsewhere.
| Rank | City | 2020 city population | 2010 city population | Change | Metropolitan Statistical Area | 2020 metro population | 2010 metro population | 2020 metro change |
|---|---|---|---|---|---|---|---|---|
| 1 | Des Moines | 214,133 | 203,433 | +5.26% | Des Moines–West Des Moines | 707,915 | 606,475 | +16.73% |
| 2 | Cedar Rapids | 137,710 | 126,326 | +9.01% | Cedar Rapids | 273,885 | 257,940 | +6.18% |
| 3 | Davenport | 101,724 | 99,685 | +2.05% | Quad Cities | 382,268 | 379,690 | +0.68% |
| 4 | Sioux City | 85,797 | 82,684 | +3.76% | Sioux City | 144,996 | 143,577 | +0.99% |
| 5 | Iowa City | 74,828 | 67,862 | +10.26% | Iowa City | 175,732 | 152,586 | +15.17% |
| 6 | West Des Moines | 68,723 | 56,609 | +21.40% | Des Moines–West Des Moines | |||
| 7 | Ankeny | 67,887 | 45,582 | +48.93% | Des Moines–West Des Moines | |||
| 8 | Waterloo | 67,314 | 68,406 | −1.60% | Waterloo–Cedar Falls | 168,314 | 167,819 | +0.29% |
| 9 | Ames | 66,427 | 58,965 | +12.65% | Ames | 124,514 | 115,848 | +7.48% |
| 10 | Council Bluffs | 62,799 | 62,230 | +0.91% | Omaha–Council Bluffs | 954,270 | 865,350 | +10.28% |
| 11 | Dubuque | 59,667 | 57,637 | +3.52% | Dubuque | 97,590 | 93,653 | +4.20% |
| 12 | Urbandale | 45,580 | 39,463 | +15.50% | Des Moines–West Des Moines | |||
| 13 | Marion | 41,535 | 34,768 | +19.46% | Cedar Rapids | |||
| 14 | Cedar Falls | 40,713 | 39,260 | +3.70% | Waterloo–Cedar Falls | |||
| 15 | Bettendorf | 39,102 | 33,217 | +17.72% | Quad Cities |
Who Lives in Iowa? Demographics
Population Numbers and Trends
| Historical population | |||
|---|---|---|---|
| Census | Pop. | %± | |
| 1840 | 43,112 | — | |
| 1850 | 192,214 | 345.8% | |
| 1860 | 674,913 | 251.1% | |
| 1870 | 1,194,020 | 76.9% | |
| 1880 | 1,624,615 | 36.1% | |
| 1890 | 1,912,297 | 17.7% | |
| 1900 | 2,231,853 | 16.7% | |
| 1910 | 2,224,771 | −0.3% | |
| 1920 | 2,404,021 | 8.1% | |
| 1930 | 2,470,939 | 2.8% | |
| 1940 | 2,538,268 | 2.7% | |
| 1950 | 2,621,073 | 3.3% | |
| 1960 | 2,757,537 | 5.2% | |
| 1970 | 2,824,376 | 2.4% | |
| 1980 | 2,913,808 | 3.2% | |
| 1990 | 2,776,755 | −4.7% | |
| 2000 | 2,926,324 | 5.4% | |
| 2010 | 3,046,355 | 4.1% | |
| 2020 | 3,190,369 | 4.7% | |
| 2023 (est.) | 3,207,004 | 5.3% | |
| Source: 1910–2020 | |||
In 2020, Iowa's population was 3,190,369. Most Iowans (70.8%) were born in the state. About 5% of the population was born in other countries.
People moving to Iowa from other countries have increased the population. However, more people have moved out of Iowa to other U.S. states. About 22.6% of Iowans are under 18, and 14.7% are 65 or older.
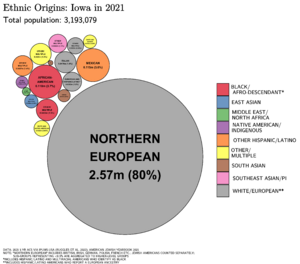
The largest ethnic group in Iowa is people of German heritage. Other large groups include those of Irish and British descent. There are also Dutch communities in places like Pella and Orange City. A Norwegian community is in Decorah, and Czech and Slovak communities are in Cedar Rapids and Iowa City.
Most Hispanic people in Iowa are of Mexican origin. African Americans make up about 2% of Iowa's population. Many African Americans moved to cities like Waterloo, Davenport, and Des Moines in the early 1900s.
| Race and Ethnicity | Alone | Total | ||
|---|---|---|---|---|
| White (non-Hispanic) | 82.7% |
|
85.9% |
|
| Hispanic or Latino | — | 6.8% |
|
|
| African American (non-Hispanic) | 4.1% |
|
5.2% |
|
| Asian | 2.4% |
|
3.0% |
|
| Native American | 0.3% |
|
1.4% |
|
| Pacific Islander | 0.2% |
|
0.3% |
|
| Other | 0.3% |
|
1.0% |
|
| Racial composition | 1990 | 2000 | 2010 | 2020 |
|---|---|---|---|---|
| White | 96.6% | 93.9% | 91.3% | 84.5% |
| Black or African American | 1.7% | 2.1% | 2.9% | 4.1% |
| Native American | 0.3% | 0.3% | 0.4% | 0.5% |
| Asian | 0.9% | 1.3% | 1.7% | 2.4% |
| Native Hawaiian and Other Pacific Islander | — | — | 0.1% | 0.2% |
| Other race | 0.5% | 1.3% | 1.8% | 2.8% |
| Two or more races | — | 1.1% | 1.8% | 5.6% |
Beliefs and Religions in Iowa

Religious self-identification, per Public Religion Research Institute's 2022 American Values Survey Protestantism (48%) Catholicism (20%) Unitarian/Universalist (1%) Unaffiliated (29%) Other (2%)
A 2014 survey showed that 60% of Iowans are Protestant, and 18% are Catholic. About 21% said they were not religious. The largest Protestant groups are the United Methodist Church and the Evangelical Lutheran Church in America. Catholicism is the largest non-Protestant religion.
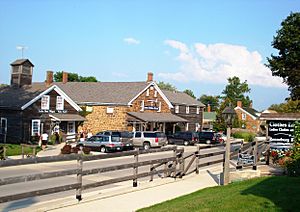
Historically, groups who wanted to live separately from society settled in Iowa. These include the Amish and Mennonite communities. The Amana Colonies were founded by German Pietists. There are also Quakers and followers of Transcendental Meditation in Iowa.
Languages Spoken in Iowa
English is the main language spoken in Iowa, used by 91.1% of the population. After English, Spanish is the second most common language. About 120,000 people in Iowa are of Hispanic or Latino origin.
German is the third most common language. Some unique German dialects are spoken in Iowa, like Amana German and Pennsylvania German. In 1918, a law called the Babel Proclamation even banned speaking German in public.
Fun Things to Do: Iowa's Attractions
Central Iowa Adventures
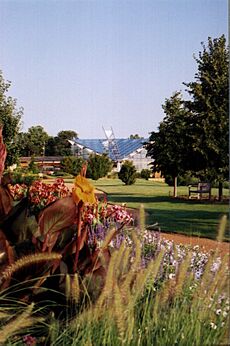
Ames is home to Iowa State University and Reiman Gardens, which has a beautiful butterfly wing.
Des Moines is Iowa's largest city and capital. You can visit the Iowa State Capitol, the State Historical Society of Iowa Museum, and the Des Moines Art Center. Nearby, you can find Adventureland amusement park and Living History Farms, which shows what farm life was like long ago.
Boone has the Boone and Scenic Valley Railroad and Ledges State Park. The Meskwaki Settlement near Tama is the only Native American settlement in Iowa. They host a big annual Pow-wow.
Madison County is famous for its covered bridges. It's also where you can find the John Wayne Birthplace Museum in Winterset.
Eastern Iowa Explorations
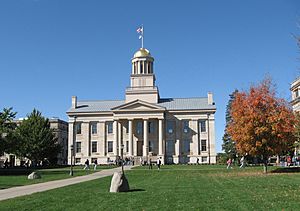
Iowa City is home to the University of Iowa and the historic Old Capitol building. Iowa City is special because it was the first American city named a "City of Literature" by the United Nations.
The Herbert Hoover National Historic Site and Presidential Library are in West Branch. The Amana Colonies are a group of seven historic German villages.
Cedar Rapids has the Cedar Rapids Museum of Art, featuring works by famous Iowa artists. It's also home to the National Czech & Slovak Museum & Library.
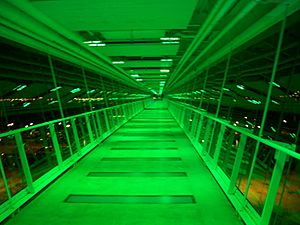
Davenport offers the Figge Art Museum, the River Music Experience, and the Davenport Skybridge. It also hosts the annual Bix Beiderbecke Memorial Jazz Festival.
Near Walcott, you can find the world's largest truck stop, Iowa 80.
Western Iowa Wonders
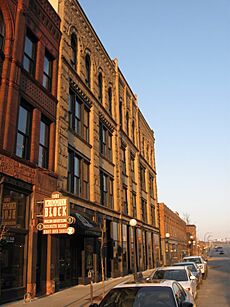
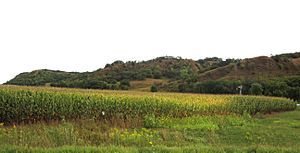
Western Iowa has amazing scenery, especially the unique Loess Hills. These hills are made of fine soil blown by the wind.
Sioux City is the largest city in western Iowa. It's located where three rivers meet. Attractions include the Hard Rock Hotel and Casino and the Sergeant Floyd Monument. Le Mars, nearby, calls itself the "Ice Cream Capital of the World" because Wells Enterprises (Blue Bunny) is there.
Council Bluffs is part of the Omaha, Nebraska, metropolitan area. It has casinos and cultural sites like the Union Pacific Railroad Museum.
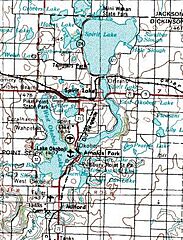
The Iowa Great Lakes area is a popular tourist spot. It includes towns like Spirit Lake and Arnolds Park. Arnolds Park has one of the oldest amusement parks in the country.
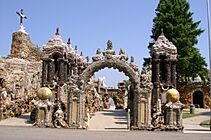
Other places to visit include the Grotto of the Redemption in West Bend and The Danish Immigrant Museum in Elk Horn. Every May, Orange City holds its annual Tulip Festival, celebrating its Dutch heritage.
Northwest Iowa has many wind turbine farms, which generate a lot of clean energy.
Northeast and Northern Iowa Highlights
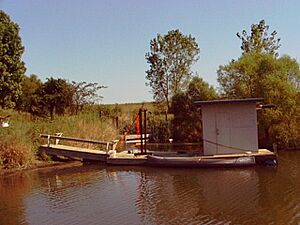
The Driftless Area in northeast Iowa has steep hills, deep valleys, and forests. Effigy Mounds National Monument has ancient mounds shaped like animals.
Waterloo is home to the Lost Island Theme Park. Cedar Falls is where the University of Northern Iowa is located.
Dubuque is a popular tourist spot. It has the National Mississippi River Museum and Aquarium. Dyersville is home to the famous Field of Dreams baseball field. Maquoketa Caves State Park has more caves than any other state park in Iowa.
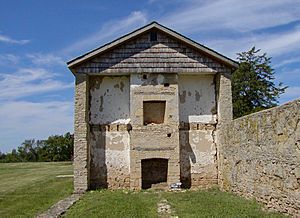
Fort Atkinson State Preserve has the remains of an old 1840s fort. Fort Dodge has a historical museum and hosts Frontier Days.
Statewide Fun in Iowa
Iowa hosts RAGBRAI, a huge annual bicycle ride across the state. Thousands of cyclists participate in this event every year. Iowa also has over 70 wineries and several wine-tasting trails. Many communities hold farmers' markets during the warmer months.
Iowa's Economy: How People Make a Living
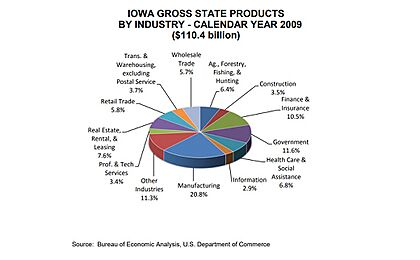
Iowa's economy is strong and diverse. In 2010, CNBC ranked Iowa as the sixth best state for business. Iowa was ranked first for the "Cost of Doing Business."
While farming is important, manufacturing, biotechnology, and financial services are also big parts of Iowa's economy. This diversity helped Iowa handle the late 2000s recession better than many other states. Iowa's unemployment rate is often lower than the national average.
Manufacturing in Iowa
Manufacturing is the largest part of Iowa's economy. It makes up 21% of Iowa's total product. Key manufacturing areas include food processing, heavy machinery, and farm chemicals. Many well-known companies have factories in Iowa, such as John Deere, Procter & Gamble, and Winnebago Industries.
Farming and Agriculture in Iowa
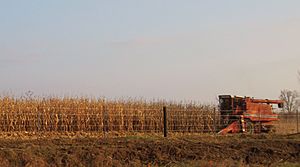
Iowa is a major farming state. Its main farm products are hogs, corn, soybeans, and eggs. Iowa is the nation's largest producer of ethanol (fuel made from corn). It is also a top producer of corn and soybeans. In 2008, Iowa farms produced a large percentage of the nation's corn, soybeans, hogs, and eggs.
In recent years, organic farming has grown in Iowa. The state ranks fifth in the U.S. for the number of organic farms. Iowa is also seeing more demand for local, sustainably grown food.
Iowa's Driftless Region is home to Seed Savers Exchange. This non-profit group protects over 20,000 types of rare, old-fashioned seeds.
Even though farming is important, it makes up a smaller part of Iowa's overall economy. However, businesses related to agriculture, like food processing, add a lot to the economy.
Other Important Industries
Iowa has a strong financial and insurance industry. Many large financial companies have offices here.
The state also has business incubators, which help new companies grow. For example, Iowa State University Research Park supports about 50 companies.
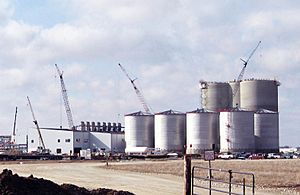
Making ethanol from corn is a big industry in Iowa. It uses about a third of Iowa's corn. Renewable fuels, like ethanol, contribute a lot to the state's economy.
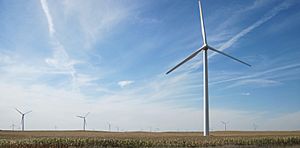
Wind power in Iowa has grown a lot since 1990. In 2019, wind power produced 42% of Iowa's electricity. Iowa ranks first among U.S. states for the percentage of power from wind. Companies that make wind turbines also have facilities in Iowa.
Many well-known companies are based in Iowa, including Hy-Vee grocery stores and Pella Corporation (windows and doors). Gambling is also a big part of Iowa's tourism industry.
Taxes in Iowa
Iowa collects taxes on income for individuals and businesses. There are different tax rates depending on how much income you have. The state sales tax rate is 6%. Property taxes are also collected by local governments.
Learning in Iowa: Education
Schools for Kids: Primary and Secondary Education
Iowa has always been a leader in education. In 2017, the high school graduation rate was 91.3%. Iowa's schools are known for having one of the highest graduation rates in the nation.
The state has 333 school districts and over 1,300 school buildings. Iowa has a low student-to-teacher ratio, meaning fewer students per teacher. The oldest school building still in use in Iowa is in Bellevue, which has been a school since 1848.
Higher Education: Colleges and Universities
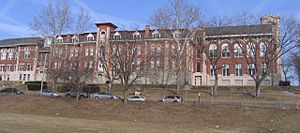
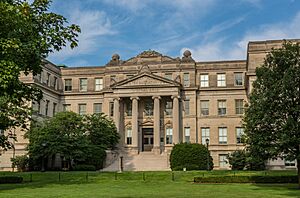
The Iowa Board of Regents oversees the state's three public universities. These include Iowa State University and The University of Iowa, which are both major research universities. The University of Iowa is also part of the important Association of American Universities.
Besides public universities, Iowa has many private colleges and universities.
Getting Around: Transportation in Iowa
Highways and Roads
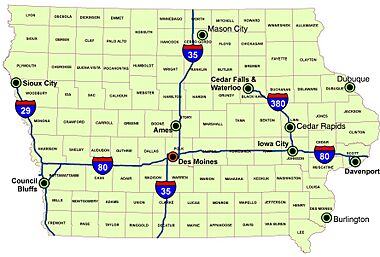
Iowa has four main interstate highways. I-29 runs along the western side of the state. I-35 goes through the center of the state, including Des Moines. I-80 crosses the state from west to east, passing through Council Bluffs, Des Moines, and Iowa City. I-380 connects I-80 to Cedar Rapids and Waterloo.
Airports and Flights
Iowa has several regional airports with scheduled flights. The largest are the Des Moines International Airport and the Eastern Iowa Airport in Cedar Rapids. Other airports serve smaller cities across the state.
Trains and Public Transport
Amtrak train services run through southern Iowa, with stops in cities like Burlington and Ottumwa. The California Zephyr and Southwest Chief trains both serve Iowa.
Many cities in Iowa have local public transit systems, like buses. Intercity bus services are also available from companies like Burlington Trailways and Greyhound Lines.
Iowa's Way of Life: Culture
Arts and Entertainment
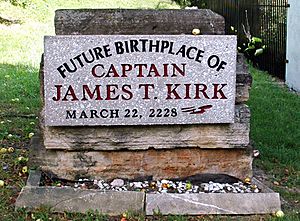
The movie The Bridges of Madison County was filmed in Madison County. The movie What's Eating Gilbert Grape is also set in a fictional Iowa town.
The heavy metal band Slipknot is from Des Moines. They even named one of their albums Iowa.
Sports in Iowa
Iowa has no major league professional sports teams. However, it has four major college teams that play in NCAA Division I. These include the University of Iowa Hawkeyes and Iowa State University Cyclones. They are big rivals and compete for the Cy-Hawk Trophy each year.
Iowa is also known for its college wrestling teams. The Iowa Hawkeyes and Iowa State Cyclones have won many national championships.
| Team | Location | Avg. attendance |
|---|---|---|
| Iowa Hawkeyes football | Iowa City | 68,043 |
| Iowa State Cyclones football | Ames | 56,010 |
| Iowa State Cyclones men's basketball | Ames | 13,375 |
| Iowa Hawkeyes men's basketball | Iowa City | 12,371 |
| Iowa Hawkeyes wrestling | Iowa City | 12,568 |
| Iowa Hawkeyes women's basketball | Iowa City | 11,143 |
| Iowa State Cyclones women's basketball | Ames | 10,323 |
| Northern Iowa Panthers football | Cedar Falls | 9,337 |
Baseball Teams in Iowa
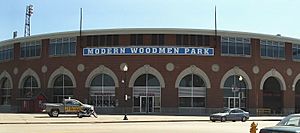
Des Moines has the Iowa Cubs, a Triple-A minor league baseball team. Iowa also has two High-A minor league teams: the Cedar Rapids Kernels and the Quad Cities River Bandits. The Sioux City Explorers play in an independent league.
Ice Hockey Teams in Iowa
The Iowa Wild is an American Hockey League (AHL) team based in Des Moines. They are connected to the Minnesota Wild, an NHL team. Coralville has an ECHL team called the Iowa Heartlanders.
Iowa also has five teams in the United States Hockey League, a junior hockey league.
Other Sports in Iowa
Iowa has two professional basketball teams: the Iowa Wolves (NBA G League) and the Sioux City Hornets. There are also three professional indoor football teams: the Sioux City Bandits, Iowa Barnstormers, and Cedar Rapids Titans.
The Iowa Speedway hosts car races, including IndyCar and NASCAR events. The Knoxville Raceway is famous for sprint car racing. Iowa also hosts PGA Tour golf events like the John Deere Classic.
Iowa's Global Friends: Sister Jurisdictions
Iowa has ten official partner regions around the world. These partnerships help build friendships and connections between Iowa and other places. Some of these partners include Yamanashi Prefecture, Japan; Hebei Province, China; and the Republic of Kosovo.
See also
 In Spanish: Iowa para niños


