
List of majority-Black counties in the United States facts for kids
This article is about counties in the United States where most people are Black or African American. It uses information from the 2020 U.S. Census.
In 2020, about 47.5 million Americans identified as Black. This made up 14.2% of the total U.S. population. The states with the largest number of Black Americans were Texas, Florida, Georgia, New York state, and California. The highest percentages of Black Americans were found in the District of Columbia, Mississippi, Louisiana, Georgia, and Maryland.
Across the country, there are 104 counties or county-equivalents where more than half of the people are Black. Many of these counties are in the Southern U.S. For example, Mississippi has 25 such counties, Georgia has 22, and Alabama has 11. Other states like South Carolina, Virginia, North Carolina, Louisiana, Arkansas, Maryland, and Tennessee also have majority-Black counties. Florida and Puerto Rico each have one.
The most populated counties with a Black majority in 2020 included Prince George's County, Maryland (with about 967,000 people), Shelby County, Tennessee (about 930,000 people), and DeKalb County, Georgia (about 764,000 people).
Contents
Counties with a Majority Black Population
This list shows counties and county-equivalents in the U.S. states, the District of Columbia, and Puerto Rico where more than 50% of the population is Black. The information includes the county's total population, the number of Black people, and the percentage of Black people, all based on the 2020 Census.
You can sort the table by clicking on the column headers. Counties in Puerto Rico are shaded yellow. Counties where the majority is Black when counting those who identify as Black alone or in combination with another race (but not Black alone) are italicized.
| County | State | Black % | Black alone % | Population | Black population |
Black alone population |
|---|---|---|---|---|---|---|
| Claiborne | 88.60% | 87.45% | 9,135 | 8,094 | 7,989 | |
| Jefferson | 86.72% | 85.28% | 7,260 | 6,296 | 6,191 | |
| Holmes | 85.23% | 83.86% | 17,000 | 14,489 | 14,256 | |
| Greene | 82.20% | 80.80% | 7,730 | 6,354 | 6,246 | |
| Macon | 80.85% | 79.05% | 19,532 | 15,792 | 15,441 | |
| Humphreys | 80.39% | 78.48% | 7,785 | 6,258 | 6,110 | |
| Tunica | 78.36% | 77.27% | 9,782 | 7,665 | 7,559 | |
| Coahoma | 77.56% | 76.12% | 21,390 | 16,590 | 16,281 | |
| Petersburg | 77.19% | 74.16% | 33,458 | 25,826 | 24,811 | |
| Leflore | 75.10% | 73.73% | 28,339 | 21,283 | 20,895 | |
| Quitman | 75.08% | 73.61% | 6,176 | 4,637 | 4,546 | |
| Sumter | 73.85% | 72.88% | 12,345 | 9,117 | 8,997 | |
| Clayton | 72.70% | 69.89% | 297,595 | 216,351 | 207,981 | |
| Washington | 72.57% | 71.33% | 44,922 | 32,601 | 32,042 | |
| Sharkey | 72.34% | 70.76% | 3,800 | 2,749 | 2,689 | |
| Bullock | 72.34% | 71.41% | 10,357 | 7,492 | 7,396 | |
| Noxubee | 72.19% | 70.27% | 10,285 | 7,425 | 7,227 | |
| Allendale | 71.76% | 70.36% | 8,039 | 5,769 | 5,656 | |
| Wilcox | 71.68% | 70.59% | 10,600 | 7,598 | 7,483 | |
| Dougherty | 71.64% | 69.92% | 85,790 | 61,457 | 59,988 | |
| Dallas | 71.49% | 69.94% | 38,462 | 27,497 | 26,899 | |
| Lowndes | 71.15% | 69.75% | 10,311 | 7,336 | 7,192 | |
| Perry | 71.08% | 69.75% | 8,511 | 6,050 | 5,936 | |
| Sunflower | 71.03% | 69.94% | 25,971 | 18,448 | 18,164 | |
| Hinds | 70.86% | 69.43% | 227,742 | 161,374 | 158,112 | |
| East Carroll | 70.68% | 69.55% | 7,459 | 5,272 | 5,188 | |
| Hancock | 70.19% | 69.01% | 8,735 | 6,131 | 6,028 | |
| Wilkinson | 69.08% | 67.39% | 8,587 | 5,932 | 5,787 | |
| Emporia | 66.04% | 63.39% | 5,766 | 3,808 | 3,655 | |
| Calhoun | 65.12% | 64.26% | 5,573 | 3,629 | 3,581 | |
| Williamsburg | 64.68% | 63.39% | 31,026 | 20,068 | 19,666 | |
| Loíza | 64.65% | 31.79% | 23,693 | 15,318 | 7,533 | |
| Bolivar | 63.81% | 62.50% | 30,985 | 19,770 | 19,365 | |
| Phillips | 63.74% | 62.43% | 16,568 | 10,560 | 10,343 | |
| Madison | 63.52% | 62.13% | 10,017 | 6,363 | 6,224 | |
| Prince George's | 63.03% | 59.83% | 967,201 | 609,663 | 578,703 | |
| Kemper | 62.36% | 61.14% | 8,988 | 5,605 | 5,495 | |
| Lee | 62.32% | 61.00% | 16,531 | 10,302 | 10,084 | |
| Terrell | 62.13% | 60.59% | 9,185 | 5,707 | 5,565 | |
| Orangeburg | 62.07% | 60.61% | 84,223 | 52,275 | 51,046 | |
| Bertie | 61.54% | 59.77% | 17,934 | 11,036 | 10,720 | |
| Randolph | 61.43% | 60.34% | 6,425 | 3,947 | 3,877 | |
| Rockdale | 61.13% | 58.15% | 93,570 | 57,204 | 54,409 | |
| Yazoo | 60.77% | 59.57% | 26,743 | 16,252 | 15,931 | |
| Baltimore City | 60.42% | 57.79% | 585,708 | 353,890 | 338,478 | |
| Macon | 60.39% | 59.29% | 12,082 | 7,296 | 7,164 | |
| Jefferson Davis | 60.15% | 58.68% | 11,321 | 6,810 | 6,643 | |
| Warren | 59.98% | 58.54% | 5,215 | 3,128 | 3,053 | |
| Bamberg | 59.61% | 58.32% | 13,311 | 7,935 | 7,763 | |
| Greensville | 59.49% | 58.44% | 11,391 | 6,776 | 6,657 | |
| Tallahatchie | 59.42% | 58.62% | 12,715 | 7,555 | 7,454 | |
| St. John the Baptist | 59.32% | 57.22% | 42,477 | 25,196 | 24,305 | |
| Hertford | 59.31% | 57.50% | 21,552 | 12,783 | 12,393 | |
| Franklin | 59.03% | 56.71% | 8,180 | 4,829 | 4,639 | |
| Clay | 58.97% | 57.97% | 18,636 | 10,989 | 10,803 | |
| Montgomery | 58.54% | 56.98% | 228,954 | 134,029 | 130,467 | |
| Adams | 58.20% | 56.83% | 29,538 | 17,192 | 16,785 | |
| Richmond | 58.07% | 55.27% | 206,607 | 119,970 | 114,201 | |
| Marion | 57.92% | 56.21% | 29,183 | 16,902 | 16,403 | |
| Edgecombe | 57.82% | 56.09% | 48,900 | 28,274 | 27,429 | |
| Issaquena | 57.77% | 56.58% | 1,338 | 773 | 757 | |
| Hale | 57.71% | 56.39% | 14,785 | 8,533 | 8,337 | |
| Jefferson | 57.62% | 56.25% | 67,260 | 38,756 | 37,835 | |
| Clay | 57.37% | 56.07% | 2,848 | 1,634 | 1,597 | |
| Northampton | 57.21% | 55.46% | 17,471 | 9,995 | 9,689 | |
| Orleans | 57.02% | 54.24% | 383,997 | 218,969 | 208,273 | |
| Portsmouth | 56.75% | 53.33% | 97,915 | 55,570 | 52,214 | |
| Bibb | 56.48% | 54.58% | 157,346 | 88,865 | 85,885 | |
| Taliaferro | 56.19% | 53.43% | 1,559 | 876 | 833 | |
| Lee | 56.13% | 54.22% | 8,600 | 4,827 | 4,663 | |
| Brunswick | 55.89% | 54.31% | 15,849 | 8,858 | 8,607 | |
| Tensas | 55.75% | 54.26% | 4,147 | 2,312 | 2,250 | |
| St. Francis | 55.54% | 54.40% | 23,090 | 12,825 | 12,561 | |
| Fairfield | 55.49% | 53.71% | 20,948 | 11,625 | 11,251 | |
| Crittenden | 55.44% | 53.79% | 48,163 | 26,700 | 25,905 | |
| St. Helena | 55.23% | 53.67% | 10,920 | 6,031 | 5,861 | |
| Sussex | 55.10% | 53.38% | 10,829 | 5,967 | 5,781 | |
| Washington | 54.88% | 53.65% | 19,988 | 10,969 | 10,724 | |
| Talbot | 54.86% | 53.71% | 5,733 | 3,145 | 3,079 | |
| Gadsden | 54.80% | 53.47% | 43,826 | 24,018 | 23,435 | |
| Pike | 54.73% | 53.47% | 40,324 | 22,068 | 21,562 | |
| Chicot | 54.31% | 53.07% | 10,208 | 5,544 | 5,417 | |
| Marengo | 53.82% | 52.72% | 19,323 | 10,400 | 10,188 | |
| Hampton | 53.65% | 49.52% | 137,148 | 73,579 | 67,915 | |
| Charles | 53.59% | 49.24% | 166,617 | 89,295 | 82,035 | |
| Danville | 53.38% | 51.37% | 42,590 | 22,734 | 21,879 | |
| DeKalb | 53.30% | 50.89% | 764,382 | 407,451 | 388,963 | |
| Shelby | 53.00% | 51.34% | 929,744 | 492,757 | 477,321 | |
| Halifax | 52.98% | 51.10% | 48,622 | 25,759 | 24,846 | |
| Hampton | 52.78% | 51.68% | 18,561 | 9,796 | 9,592 | |
| Sumter | 52.49% | 51.05% | 29,616 | 15,546 | 15,120 | |
| Early | 52.40% | 51.24% | 10,854 | 5,688 | 5,562 | |
| Jefferson | 52.25% | 50.77% | 15,709 | 8,208 | 7,976 | |
| Marlboro | 52.22% | 50.22% | 26,667 | 13,926 | 13,391 | |
| Henry | 52.02% | 49.07% | 240,712 | 125,211 | 118,124 | |
| Copiah | 51.98% | 50.56% | 28,368 | 14,747 | 14,342 | |
| Jasper | 51.97% | 50.96% | 16,367 | 8,506 | 8,341 | |
| Haywood | 51.84% | 50.56% | 17,864 | 9,260 | 9,032 | |
| Vance | 51.71% | 49.88% | 42,578 | 22,017 | 21,237 | |
| Douglas | 51.48% | 48.44% | 144,237 | 74,260 | 69,870 | |
| Warren | 51.10% | 48.89% | 18,642 | 9,526 | 9,114 | |
| Dooly | 50.43% | 49.62% | 11,208 | 5,652 | 5,561 | |
| Washington | 50.36% | 48.85% | 11,003 | 5,541 | 5,375 | |
| Caddo | 50.16% | 48.48% | 237,848 | 119,304 | 115,298 |
Understanding Income in Majority-Black Counties
The income levels in these counties can vary a lot. For example, in 2023, Charles County, Maryland, and Prince George's County, Maryland, had some of the highest median incomes, over $90,000. This means that half the households in these counties earned more than that amount, and half earned less. On the other hand, some counties, like Issaquena County, Mississippi, had median incomes below $20,000. These numbers help us understand the economic situations in different areas.
Source: United States Census Bureau, 2023
See also
- African Americans
- List of majority-Hispanic or Latino counties in the United States
Images for kids
-
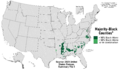
Majority-Black Counties in the U.S. as of the 2020 United States Census

