
Global Innovation Index facts for kids

Report cover of the Global Innovation Index Report 2025
|
|
|
Abbreviated title (ISO 4)
|
Glob. Innov. Index |
|---|---|
| Language | English, French, Italian, Spanish, Arabic, Chinese, Russian, German, Korean, Portuguese, Japanese |
| Publication details | |
| Publisher |
World Intellectual Property Organization
|
|
Publication history
|
2007–present |
| Frequency | Annual |
| License | CC BY 4.0 |
| Indexing | |
| ISSN | 2263-3693 |
| Links | |
|
|

The Global Innovation Index (GII) is a yearly report. It ranks countries based on how good they are at innovation. Innovation means creating new ideas, products, or ways of doing things. The World Intellectual Property Organization (WIPO) publishes this important report. It helps us understand which countries are leading the way in new inventions and ideas.
Contents
How the Global Innovation Index Started
The Global Innovation Index began in 2007. It was created by Soumitra Dutta. It started with the help of INSEAD, a business school, and World Business magazine. The main goal was to track how countries innovate.
How Innovation is Measured
The Global Innovation Index uses a special method to rank countries. It looks at two main parts to measure innovation:
- Innovation Input Index: This measures things that help innovation. For example, how much a country invests in education or research.
- Innovation Output Index: This measures the results of innovation. For example, how many new patents or creative products a country produces.
Each part has smaller sections called "pillars." These pillars look at different aspects of innovation. Experts combine all these scores to get a final ranking. Governments around the world use this index. They learn how to improve their country's ability to innovate. The General Assembly of the United Nations even mentioned it. They see it as important for sustainable development.
Special Focus Themes
Every two years, the Global Innovation Index picks a special theme. This theme explores a specific area of innovation. For example, in 2020, the theme was about "Who will pay for innovation?" This helped people understand how new ideas get funding. Other themes have looked at new ideas in health, the environment, and food. These themes help us think deeply about different kinds of innovation.
Top Innovators in 2025

The 2025 Global Innovation Index ranked 139 countries. To be included, countries needed enough information. This year, the index used 78 different ways to measure innovation. These measurements help create a fair ranking.
Here are the top countries for innovation in 2025:
| Rank | Country and region | Score | Income group |
|---|---|---|---|
| 1 | 66.0 | High-income | |
| 2 | 62.6 | High-income | |
| 3 | 61.7 | High-income | |
| 4 | 60.0 | High-income | |
| 5 | 59.9 | High-income | |
| 6 | 59.1 | High-income | |
| 7 | 57.7 | High-income | |
| 8 | 57.0 | High-income | |
| 9 | 56.9 | High-income | |
| 10 | 56.6 | Upper middle-income | |
| 11 | 55.5 | High-income | |
| 12 | 53.6 | High-income | |
| 13 | 53.4 | High-income | |
| 14 | 52.3 | High-income | |
| 15 | 51.5 | High-income | |
| 16 | 51.1 | High-income | |
| 17 | 51.1 | High-income | |
| 18 | 50.4 | High-income | |
| 19 | 50.1 | High-income | |
| 20 | 49.2 | High-income | |
| 21 | 48.5 | High-income | |
| 22 | 48.0 | High-income | |
| 23 | 47.3 | High-income | |
| 24 | 47.0 | High-income | |
| 25 | 45.5 | High-income | |
| 26 | 45.5 | High-income | |
| 27 | 45.4 | High-income | |
| 28 | 44.9 | High-income | |
| 29 | 44.6 | High-income | |
| 30 | 44.2 | High-income | |
| 31 | 43.9 | High-income | |
| 32 | 42.0 | High-income | |
| 33 | 40.8 | High-income | |
| 34 | 40.6 | Upper middle-income | |
| 35 | 40.1 | High-income | |
| 36 | 40.0 | High-income | |
| 37 | 39.1 | High-income | |
| 38 | 38.2 | Lower middle-income | |
| 39 | 37.7 | High-income | |
| 40 | 37.7 | High-income | |
| 41 | 37.5 | High-income | |
| 42 | 37.4 | High-income | |
| 43 | 37.2 | High-income | |
| 44 | 37.1 | Lower middle-income | |
| 45 | 36.7 | Upper middle-income | |
| 46 | 36.0 | High-income | |
| 47 | 35.5 | High-income | |
| 48 | 34.6 | High-income | |
| 49 | 34.3 | High-income | |
| 50 | 33.6 | Lower middle-income | |
| 51 | 33.1 | High-income | |
| 52 | 32.9 | Upper middle-income | |
| 53 | 32.5 | Upper middle-income | |
| 54 | 31.7 | Upper middle-income | |
| 55 | 31.3 | Upper middle-income | |
| 56 | 31.2 | Upper middle-income | |
| 57 | 31.1 | Lower middle-income | |
| 58 | 30.5 | Upper middle-income | |
| 59 | 30.5 | Upper middle-income | |
| 60 | 30.3 | High-income | |
| 61 | 30.1 | Upper middle-income | |
| 62 | 30.0 | High-income | |
| 63 | 29.8 | Upper middle-income | |
| 64 | 29.8 | Upper middle-income | |
| 65 | 29.7 | Lower middle-income | |
| 66 | 29.7 | Lower middle-income | |
| 67 | 29.6 | Upper middle-income | |
| 68 | 28.8 | High-income | |
| 69 | 28.7 | High-income | |
| 70 | 28.5 | Lower middle-income | |
| 71 | 28.5 | Upper middle-income | |
| 72 | 28.4 | High-income | |
| 73 | 28.2 | High-income | |
| 74 | 27.4 | Upper middle-income | |
| 75 | 27.2 | High-income | |
| 76 | 27.0 | Lower middle-income | |
| 77 | 26.8 | Upper middle-income | |
| 78 | 26.7 | Upper middle-income | |
| 79 | 26.5 | Lower middle-income | |
| 80 | 26.5 | Upper middle-income | |
| 81 | 26.3 | Upper middle-income | |
| 82 | 25.9 | High-income | |
| 83 | 25.2 | Upper middle-income | |
| 84 | 25.1 | High-income | |
| 85 | 25.1 | Upper middle-income | |
| 86 | 24.7 | Lower middle-income | |
| 87 | 24.6 | Upper middle-income | |
| 88 | 24.5 | High-income | |
| 89 | 23.8 | Lower middle-income | |
| 90 | 23.6 | Lower middle-income | |
| 91 | 23.5 | Lower middle-income | |
| 92 | 23.4 | Upper middle-income | |
| 93 | 22.9 | Lower middle-income | |
| 94 | 22.9 | Upper middle-income | |
| 95 | 22.6 | Lower middle-income | |
| 96 | 22.6 | Lower middle-income | |
| 97 | 22.6 | Upper middle-income | |
| 98 | 22.2 | Upper middle-income | |
| 99 | 22.1 | Lower middle-income | |
| 100 | 21.9 | Lower middle-income | |
| 101 | 21.9 | Lower middle-income | |
| 102 | 21.4 | Upper middle-income | |
| 103 | 21.4 | Lower middle-income | |
| 104 | 21.1 | Low-income | |
| 105 | 21.1 | Lower middle-income | |
| 106 | 21.0 | Lower middle-income | |
| 107 | 20.2 | Lower middle-income | |
| 108 | 20.2 | Lower middle-income | |
| 109 | 20.1 | Lower middle-income | |
| 110 | 19.7 | Lower middle-income | |
| 111 | 19.6 | Lower middle-income | |
| 112 | 19.6 | Lower middle-income | |
| 113 | 19.5 | Upper middle-income | |
| 114 | 19.3 | High-income | |
| 115 | 18.9 | Lower middle-income | |
| 116 | 18.2 | Lower middle-income | |
| 117 | 18.1 | Low-income | |
| 118 | 17.8 | Lower middle-income | |
| 119 | 17.7 | Lower middle-income | |
| 120 | 17.6 | Low-income | |
| 121 | 17.5 | Low-income | |
| 122 | 17.3 | Lower middle-income | |
| 123 | 17.1 | Upper middle-income | |
| 124 | 17.1 | Lower middle-income | |
| 125 | 16.0 | Low-income | |
| 126 | 15.9 | Low-income | |
| 127 | 15.8 | Low-income | |
| 128 | 15.4 | Low-income | |
| 129 | 15.4 | Lower middle-income | |
| 130 | 15.4 | Lower middle-income | |
| 131 | 15.4 | Low-income | |
| 132 | 14.9 | Low-income | |
| 133 | 14.9 | Lower middle-income | |
| 134 | 14.4 | Low-income | |
| 135 | 14.0 | Low-income | |
| 136 | 13.7 | Lower middle-income | |
| 137 | 13.6 | Lower middle-income | |
| 138 | 13.0 | Lower middle-income | |
| 139 | 11.9 | Low-income |
See also
- International Innovation Index
Images for kids
-
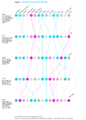
This chart shows how the top 10 countries in the Global Innovation Index changed between 2018 and 2022.

