List of towns in Alberta facts for kids
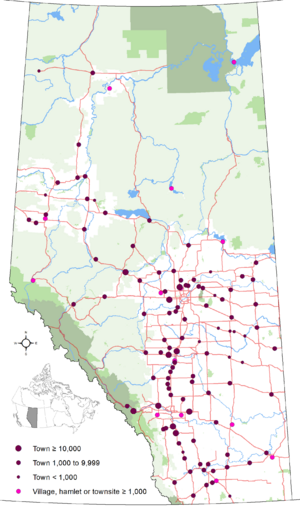
A town in Alberta, Canada, is a type of urban community. To become a town, a community needs at least 1,000 people. Most of its buildings must be on smaller pieces of land (less than 1,850 square meters). If a community meets these rules, it can ask the Alberta government to become a town. The government then makes an official decision to approve it.
Alberta has 105 towns. In 2016, these towns had a total population of about 455,053 people. On average, each town had about 4,293 residents. The biggest town in Alberta is Okotoks, with over 28,000 people. The smallest is Stavely, with around 541 people. Diamond Valley is Alberta's newest town. It was formed on January 1, 2023, when the towns of Black Diamond and Turner Valley joined together.
If a town grows to have more than 10,000 people, its leaders can ask for it to become a city. However, this is not a rule; they can choose to stay a town. Also, if a town's population drops below 1,000, it can still keep its town status.
About 699 elected officials, including 107 mayors and 592 councillors, help run the towns across Alberta. Many towns in Alberta are located along the Queen Elizabeth II Highway and Highway 2A between Calgary and Edmonton. Some of these towns include Crossfield, Carstairs, Didsbury, Olds, Bowden, Innisfail, Penhold, Blackfalds, Ponoka, and Millet.
How Towns Are Run
Every town in Alberta is managed by a council. A town council always has an odd number of members. One of these members is the town's main elected leader, called the mayor. Usually, a town council has seven members. However, a town can decide to have a different odd number, but it must have at least three members. For example, from 2017 to 2021, 82 towns had seven council members, and 25 towns had five.
The mayor and councillors are chosen by a public vote. Having an odd number of members helps avoid tie votes when decisions are made. To run for mayor or councillor, a person must have lived in the town for at least six months before the election day. The last local election was on October 16, 2017.
The provincial government department called Alberta Municipal Affairs helps coordinate all local governments. Towns are responsible for many important services. These include public safety, local transportation, roads, water supply, and garbage collection. They also work with provincial and regional groups on bigger projects like building roads, schools, and health services.
List of Alberta Towns
This section lists the communities in Alberta that are officially called "towns."
Some communities, like Crowsnest Pass and Jasper, are not listed here. This is because they are "specialized municipalities," which is a different type of community. You can learn more about them in the article on Specialized municipalities of Alberta.
| Top - 0-9 A B C D E F G H I J K L M N O P Q R S T U V W X Y Z |
| Name | Nearby Municipality | Became a Town | Population (2016) |
Land Area (km2) |
||
|---|---|---|---|---|---|---|
| Athabasca | Athabasca County | September 19, 1911 | 2,965 | 2,990 | −0.8% | 17.65 |
| Banff | Improvement District No. 9 (Banff) | January 1, 1990 | 7,851 | 7,584 | +3.5% | 4.77 |
| Barrhead | Barrhead No. 11, County of | November 26, 1946 | 4,579 | 4,432 | +3.3% | 8.17 |
| Bashaw | Camrose County | May 1, 1964 | 830 | 873 | −4.9% | 2.99 |
| Bassano | Newell, County of | January 16, 1911 | 1,206 | 1,282 | −5.9% | 5.22 |
| Beaverlodge | Grande Prairie No. 1, County of | January 24, 1956 | 2,465 | 2,365 | +4.2% | 5.73 |
| Bentley | Lacombe County | January 1, 2001 | 1,078 | 1,073 | +0.5% | 2.24 |
| Blackfalds | Lacombe County | April 1, 1980 | 9,328 | 6,300 | +48.1% | 16.44 |
| Bon Accord | Sturgeon County | November 20, 1979 | 1,529 | 1,488 | +2.8% | 2.13 |
| Bonnyville | Bonnyville No. 87, M.D. of | February 3, 1948 | 5,975 | 6,216 | −3.9% | 14.18 |
| Bow Island | Forty Mile No. 8, County of | February 1, 1912 | 1,983 | 2,025 | −2.1% | 5.81 |
| Bowden | Red Deer County | September 1, 1981 | 1,240 | 1,241 | −0.1% | 2.8 |
| Bruderheim | Lamont County | September 17, 1980 | 1,308 | 1,155 | +13.2% | 7.12 |
| Calmar | Leduc County | January 19, 1954 | 2,228 | 1,970 | +13.1% | 4.68 |
| Canmore | Bighorn No. 8, M.D. of Kananaskis Improvement District |
June 1, 1966 | 13,992 | 12,288 | +13.9% | 69.43 |
| Cardston | Cardston County | July 2, 1901 | 3,585 | 3,580 | +0.1% | 8.59 |
| Carstairs | Mountain View County | September 1, 1966 | 4,077 | 3,442 | +18.4% | 11.92 |
| Castor | Paintearth No. 18, County of | June 27, 1910 | 929 | 932 | −0.3% | 2.63 |
| Claresholm | Willow Creek No. 26, M.D. of | August 31, 1905 | 3,780 | 3,758 | +0.6% | 8.11 |
| Coaldale | Lethbridge County | January 7, 1952 | 8,215 | 7,493 | +9.6% | 7.99 |
| Coalhurst | Lethbridge County | June 1, 1995 | 2,668 | 1,978 | +34.9% | 3.11 |
| Cochrane | Rocky View County | February 15, 1971 | 25,853 | 17,580 | +47.1% | 29.83 |
| Coronation | Paintearth No. 18, County of | April 29, 1912 | 940 | 947 | −0.7% | 3.62 |
| Crossfield | Rocky View County | August 1, 1980 | 2,983 | 2,853 | +4.6% | 11.96 |
| Daysland | Flagstaff County | April 2, 1907 | 824 | 807 | +2.1% | 1.75 |
| Devon | Leduc County | February 24, 1950 | 6,578 | 6,515 | +1.0% | 14.3 |
| Diamond Valley | Foothills County | January 1, 2023 | 5,259 | 4,540 | +15.8% | 9.63 |
| Didsbury | Mountain View County | September 27, 1906 | 5,268 | 4,957 | +6.3% | 16.37 |
| Drayton Valley | Brazeau County | February 1, 1957 | 7,235 | 7,118 | +1.6% | 30.72 |
| Drumheller | Kneehill County Special Area No. 2 Starland County Wheatland County |
March 2, 1916 January 1, 1998 |
7,982 | 8,029 | −0.6% | 108.03 |
| Eckville | Lacombe County | July 1, 1966 | 1,125 | 1,125 | 0.0% | 1.6 |
| Edson | Yellowhead County | September 21, 1911 | 8,414 | 8,475 | −0.7% | 29.72 |
| Elk Point | St. Paul No. 19, County of | January 1, 1962 | 1,452 | 1,412 | +2.8% | 4.91 |
| Fairview | Fairview No. 136, M.D. of | April 25, 1949 | 2,998 | 3,162 | −5.2% | 11.36 |
| Falher | Smoky River No. 130, M.D. of | January 1, 1955 | 1,047 | 1,075 | −2.6% | 2.78 |
| Fort Macleod | Willow Creek No. 26, M.D. of | March 29, 1912 | 2,967 | 3,117 | −4.8% | 23.41 |
| Fox Creek | Greenview No. 16, M.D. of | September 1, 1983 | 1,971 | 1,969 | +0.1% | 12.36 |
| Gibbons | Sturgeon County | April 1, 1977 | 3,159 | 3,030 | +4.3% | 7.5 |
| Grimshaw | Peace No. 135, M.D. of | February 2, 1953 | 2,718 | 2,515 | +8.1% | 7.09 |
| Hanna | Special Area No. 2 | April 14, 1914 | 2,559 | 2,673 | −4.3% | 8.81 |
| Hardisty | Flagstaff County | November 9, 1910 | 554 | 639 | −13.3% | 5.13 |
| High Level | Mackenzie County | September 1, 1983 | 3,159 | 3,641 | −13.2% | 29.2 |
| High Prairie | Big Lakes County | January 10, 1950 | 2,564 | 2,600 | −1.4% | 7.22 |
| High River | Foothills No. 31, M.D. of | February 12, 1906 | 13,584 | 12,930 | +5.1% | 21.39 |
| Hinton | Yellowhead County | December 29, 1958 | 9,882 | 9,640 | +2.5% | 33.52 |
| Innisfail | Red Deer County | November 20, 1903 | 7,847 | 7,876 | −0.4% | 19.4 |
| Irricana | Rocky View County | June 9, 2005 | 1,216 | 1,162 | +4.6% | 3.23 |
| Killam | Flagstaff County | May 1, 1965 | 989 | 981 | +0.8% | 6.75 |
| Lamont | Lamont County | May 31, 1968 | 1,774 | 1,753 | +1.2% | 9.2 |
| Legal | Sturgeon County | January 1, 1998 | 1,345 | 1,225 | +9.8% | 3.18 |
| Magrath | Cardston County | July 24, 1907 | 2,374 | 2,217 | +7.1% | 5.99 |
| Manning | Northern Lights, County of | January 1, 1957 | 1,183 | 1,164 | +1.6% | 4.05 |
| Mayerthorpe | Lac Ste. Anne County | March 20, 1961 | 1,320 | 1,398 | −5.6% | 4.37 |
| McLennan | Smoky River No. 130, M.D. of | February 11, 1948 | 701 | 809 | −13.3% | 3.71 |
| Milk River | Warner No. 5, County of | February 7, 1956 | 827 | 811 | +2.0% | 2.33 |
| Millet | Wetaskiwin No. 10, County of | September 1, 1983 | 1,945 | 2,092 | −7.0% | 3.72 |
| Morinville | Sturgeon County | April 21, 1911 | 9,848 | 8,569 | +14.9% | 11.15 |
| Mundare | Lamont County | January 4, 1951 | 852 | 855 | −0.4% | 4.21 |
| Nanton | Willow Creek No. 26, M.D. of | August 9, 1907 | 2,181 | 2,132 | +2.3% | 4.87 |
| Nobleford | Lethbridge County | February 28, 2018 | 1,278 | 1,000 | +27.8% | 1.59 |
| Okotoks | Foothills No. 31, M.D. of | June 1, 1904 | 28,881 | 24,511 | +17.8% | 19.63 |
| Olds | Mountain View County | July 1, 1905 | 9,184 | 8,235 | +11.5% | 14.93 |
| Onoway | Lac Ste. Anne County | September 1, 2005 | 1,029 | 1,039 | −1.0% | 3.32 |
| Oyen | Special Area No. 3 | September 1, 1965 | 1,001 | 973 | +2.9% | 5.28 |
| Peace River | Northern Lights, County of Northern Sunrise County Peace No. 135, M.D. of |
December 1, 1919 | 6,842 | 6,729 | +1.7% | 26.26 |
| Penhold | Red Deer County | September 1, 1980 | 3,277 | 2,375 | +38.0% | 5.29 |
| Picture Butte | Lethbridge County | January 1, 1960 | 1,810 | 1,650 | +9.7% | 2.85 |
| Pincher Creek | Pincher Creek No. 9, M.D. of | May 12, 1906 | 3,642 | 3,685 | −1.2% | 10.09 |
| Ponoka | Ponoka County | October 15, 1904 | 7,229 | 6,778 | +6.7% | 17.33 |
| Provost | Provost No. 52, M.D. of | December 29, 1952 | 1,998 | 2,041 | −2.1% | 4.72 |
| Rainbow Lake | Mackenzie County | September 1, 1995 | 795 | 870 | −8.6% | 10.76 |
| Raymond | Warner No. 5, County of | July 1, 1903 | 3,708 | 3,743 | −0.9% | 6.66 |
| Redcliff | Cypress County | August 5, 1912 | 5,600 | 5,588 | +0.2% | 16.25 |
| Redwater | Sturgeon County | December 31, 1950 | 2,053 | 1,915 | +7.2% | 20.03 |
| Rimbey | Ponoka County | December 13, 1948 | 2,567 | 2,378 | +7.9% | 11.4 |
| Rocky Mountain House | Clearwater County | August 31, 1939 | 6,635 | 6,933 | −4.3% | 12.71 |
| Sedgewick | Flagstaff County | May 1, 1966 | 811 | 857 | −5.4% | 2.72 |
| Sexsmith | Grande Prairie No. 1, County of | October 15, 1979 | 2,620 | 2,418 | +8.4% | 13.24 |
| Slave Lake | Lesser Slave River No. 124, M.D. of | August 2, 1965 | 6,651 | 6,782 | −1.9% | 14.44 |
| Smoky Lake | Smoky Lake County | February 1, 1962 | 964 | 1,022 | −5.7% | 4.26 |
| Spirit River | Spirit River No. 133, M.D. of | September 18, 1951 | 995 | 1,025 | −2.9% | 3.14 |
| St. Paul | St. Paul No. 19, County of | December 15, 1936 | 5,827 | 5,405 | +7.8% | 8.64 |
| Stavely | Willow Creek No. 26, M.D. of | May 25, 1912 | 541 | 505 | +7.1% | 1.83 |
| Stettler | Stettler No. 6, County of | November 23, 1906 | 5,952 | 5,748 | +3.5% | 13.14 |
| Stony Plain | Parkland County | December 10, 1908 | 17,189 | 15,051 | +14.2% | 35.72 |
| Strathmore | Wheatland County | July 6, 1911 | 13,756 | 12,305 | +11.8% | 27.4 |
| Sundre | Mountain View County | January 1, 1956 | 2,729 | 2,610 | +4.6% | 11.11 |
| Swan Hills | Big Lakes County | January 1, 1967 | 1,301 | 1,465 | −11.2% | 26.12 |
| Sylvan Lake | Red Deer County | May 20, 1946 | 14,816 | 12,362 | +19.9% | 23.36 |
| Taber | Taber, M.D. of | July 1, 1907 | 8,428 | 8,104 | +4.0% | 15.67 |
| Thorsby | Leduc County | January 1, 2017 | 985 | 951 | +3.6% | 3.85 |
| Three Hills | Kneehill County | January 1, 1929 | 3,212 | 3,198 | +0.4% | 6.75 |
| Tofield | Beaver County | September 10, 1909 | 2,081 | 2,182 | −4.6% | 8.21 |
| Trochu | Kneehill County | August 1, 1962 | 1,058 | 1,072 | −1.3% | 2.78 |
| Two Hills | Two Hills No. 21, County of | January 1, 1955 | 1,352 | 1,379 | −2.0% | 3.38 |
| Valleyview | Greenview No. 16, M.D. of | February 5, 1957 | 1,863 | 1,761 | +5.8% | 9.32 |
| Vauxhall | Taber, M.D. of | January 1, 1961 | 1,222 | 1,288 | −5.1% | 2.72 |
| Vegreville | Minburn No. 27, County of | August 15, 1906 | 5,708 | 5,717 | −0.2% | 14.08 |
| Vermilion | Vermilion River, County of | August 27, 1906 | 4,084 | 3,930 | +3.9% | 12.93 |
| Viking | Beaver County | November 10, 1952 | 1,083 | 1,041 | +4.0% | 3.7 |
| Vulcan | Vulcan County | June 15, 1921 | 1,917 | 1,836 | +4.4% | 6.34 |
| Wainwright | Wainwright No. 61, M.D. of | July 14, 1910 | 6,270 | 5,925 | +5.8% | 9.1 |
| Wembley | Grande Prairie No. 1, County of | August 1, 1980 | 1,516 | 1,383 | +9.6% | 4.75 |
| Westlock | Westlock County | January 7, 1947 | 5,101 | 4,823 | +5.8% | 13.37 |
| Whitecourt | Woodlands County | December 20, 1971 | 10,204 | 9,605 | +6.2% | 26.44 |
| Total towns | — | — | 454,181 | 420,498 | +8.0% | 1,248.01 |
What Were "New Towns"?
A "new town" was a special type of community status in Alberta that is no longer used. This status was created by a law called The New Towns Act in 1956.
At least 12 communities became "new towns" between 1956 and 1967. Cynthia and Drayton Valley were the first, becoming new towns on June 1, 1956. Drayton Valley had only been a village for six months before this change. It was also a new town for the shortest time, just eight months.
Fox Creek was the last community to become a new town on July 19, 1967. It had not been an official community before that. Fox Creek remained a new town for over 16 years until it became a regular town on September 1, 1983.
Rainbow Lake was the last community to have the "new town" status. It changed to a regular town in 1994. Rainbow Lake was a new town for almost 28 years, the longest period of any community.
Some communities, like Slave Lake and Smith, also tried to become new towns. Slave Lake wanted extra money from the province but was denied. Smith's request was also denied because the province thought it wouldn't grow much.
Most of these "new towns" were resource communities in northern or west-central Alberta. They were often newly built communities. St. Albert was different; it was not in northern or west-central Alberta and had been a municipality since 1899.
| Former New Town | Became a New Town | What it was before | When its status changed | What it became next |
|---|---|---|---|---|
| Cynthia | June 1, 1956 | Not officially a community | May 1, 1959 | Hamlet |
| Drayton Valley | June 1, 1956 | Village | February 1, 1957 | Town |
| Fort McMurray | June 30, 1964 | Town | September 1, 1980 | City |
| Fox Creek | July 19, 1967 | Not officially a community | September 1, 1983 | Town |
| Grande Cache | September 1, 1966 | Not officially a community | September 1, 1983 | Town |
| High Level | June 1, 1965 | Hamlet | September 1, 1983 | Town |
| Hinton | November 1, 1956 | Hamlet | December 29, 1958 | Town |
| Lodgepole | July 1, 1956 | Not officially a community | March 1, 1970 | Hamlet |
| Rainbow Lake | September 1, 1966 | Not officially a community | May 2, 1994 | Town |
| St. Albert | January 1, 1957 | Town | July 3, 1962 | Town |
| Swan Hills | September 1, 1959 | Not officially a community | January 1, 1967 | Town |
| Whitecourt | August 15, 1961 | Village | December 20, 1971 | Town |
Towns That Changed Status
Many cities in Alberta used to be towns. Even some former cities, like Fort McMurray and Strathcona, were once towns.
Other communities that used to be towns include Beverly, Big Valley, Blairmore, Bowness, Black Diamond, Carmangay, Coleman, Cynthia, Diamond City, Forest Lawn, Gleichen, Grande Cache, Grand Centre, Grouard, Irvine, Jasper Place, Lac La Biche, Lodgepole, Montgomery, Turner Valley, and Youngstown.
Today, only the villages of Big Valley, Carmangay, and Youngstown are still official municipalities. The others either joined with other communities to form new municipalities (like Blairmore, Coleman, Grand Centre, and Lac La Biche). Some were absorbed by larger cities like Calgary (Bowness, Forest Lawn, and Montgomery) or Edmonton (Beverly and Jasper Place). Others became hamlets under the control of municipal districts (Cynthia, Diamond City, Gleichen, Grande Cache, Grouard, Irvine, and Lodgepole).
Communities That Could Become Towns
Some villages and hamlets in Alberta already have enough people to become towns. For example, the villages of Stirling, Duchess, and Alberta Beach all have populations over 1,000.
Also, at least ten hamlets have enough people to become towns. These include Cardiff, Clairmont, Dunmore, Fort Chipewyan, Grande Cache, La Crete, Lac La Biche, Langdon, Springbrook, and Wabasca.
Towns That Could Become Cities
Currently, nine towns in Alberta have populations over 10,000, which means they could become cities. These towns are Blackfalds, Canmore, Cochrane, High River, Okotoks, Stony Plain, Strathmore, Sylvan Lake, and Whitecourt.
The town of Hinton has also said it wants to become a city once its population reaches 10,000. In 2016, its population was 9,882, very close to the goal. In 2016, Morinville also looked into becoming a city or a specialized municipality. Their census showed a population of 9,893, just 107 people short of 10,000.
Images for kids
 | Janet Taylor Pickett |
 | Synthia Saint James |
 | Howardena Pindell |
 | Faith Ringgold |


