
List of communities in Alberta facts for kids


In Alberta, Canada, there are many different ways that local areas are governed. Think of it like different types of neighborhoods or communities, each with its own rules and leaders. These local governments help manage things like roads, parks, and services for the people living there.
There are ten main types of local governments in Alberta. These include urban areas like cities, towns, villages, and summer villages. There are also specialized municipalities and rural municipalities. Rural municipalities include municipal districts (often called counties), improvement districts, and special areas.
Other types of local governments are Métis settlements and Indian reserves. Most of these local governments are run by the people who live there. However, improvement districts are managed by the provincial or federal government. Indian reserves are governed by their own local band governments.
Alberta also has many communities that are not independent governments. These are called unincorporated communities. They include urban service areas, hamlets, and a townsite. These places are part of larger specialized or rural municipalities.
The rules for most of Alberta's local governments come from special laws. These laws are the Municipal Government Act, the Special Areas Act, and the Metis Settlements Act. In 2019, about 4.2 million people lived in all of Alberta's municipalities combined.
Types of Local Governments
Urban Communities
Urban communities are places where many people live close together. They are usually towns or cities.
Cities
Cities are the largest urban communities in Alberta. To become a city, an area needs to have at least 10,000 people. Most of its buildings must also be on smaller pieces of land. This means it's a busy, developed area.
Alberta has 19 cities. In 2019, over 2.9 million people lived in these cities. A city in Alberta, Canada, is the highest type of local government for a town or community. To become a city, a community needs to have at least 10,000 people living there. Most of its buildings also need to be on smaller pieces of land. When a community meets these rules, it can ask the Alberta government to become a city.
Alberta has 19 cities. In 2021, over 3 million people lived in these cities combined. The biggest city in Alberta is Calgary, with more than 1.3 million people. The smallest city is Wetaskiwin, with about 12,500 people. Beaumont became Alberta's newest city on January 1, 2019.
Cities in Alberta are run by elected officials. There are 19 mayors and 138 councillors who help manage the cities. Many cities are close together in the Edmonton Metropolitan Region and the Calgary Metropolitan Region. For example, Edmonton, Fort Saskatchewan, Leduc, Spruce Grove, and St. Albert are all cities near Edmonton. Airdrie, Calgary, and Chestermere are cities near Calgary.

How Cities Are Run
Every city in Alberta has an elected council that helps run things. A city council always has an odd number of members. This is so they can avoid tie votes when making decisions. One of these members is the city's main elected leader, called the mayor.
Most city councils have seven members, including the mayor. But a city can choose to have more or fewer members, as long as it's an odd number and not less than three. The mayor is chosen by all the voters in the city.
For the other council members, cities can use a "ward system." This means the city is divided into areas called wards. Each ward elects its own councillor. Wards are usually set up to have about the same number of people. If there's no ward system, all councillors are elected by everyone in the city, just like the mayor.
Everyone who can vote in a city election gets to choose their mayor and councillors. To run for mayor or councillor, a person must have lived in that city for at least six months. The last city elections in Alberta were held on October 18, 2021. The only exception is Lloydminster, which follows Saskatchewan's election schedule.
The Alberta government has a department called Alberta Municipal Affairs. This department helps coordinate all local governments, including cities.
Cities have many important jobs to do. They are in charge of things like public safety (police and fire), local buses and trains, roads, water services, and garbage collection. They also work with the province and other local areas on bigger projects like building major roads, schools, and health services.
Images
-
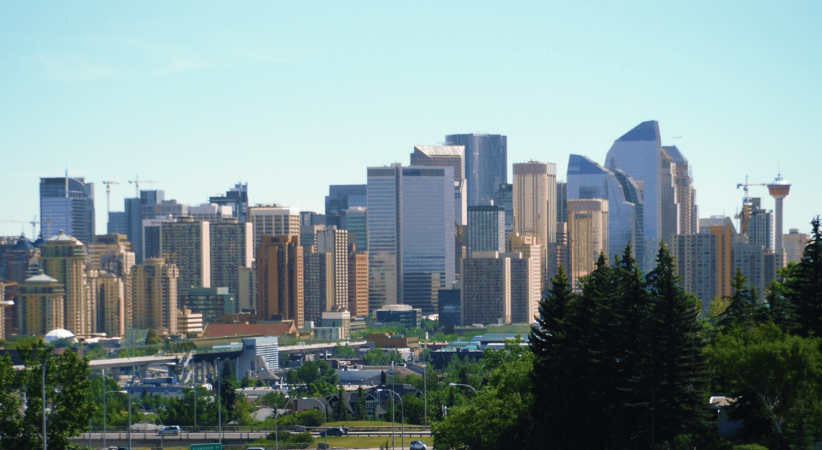
Calgary (2015)
-
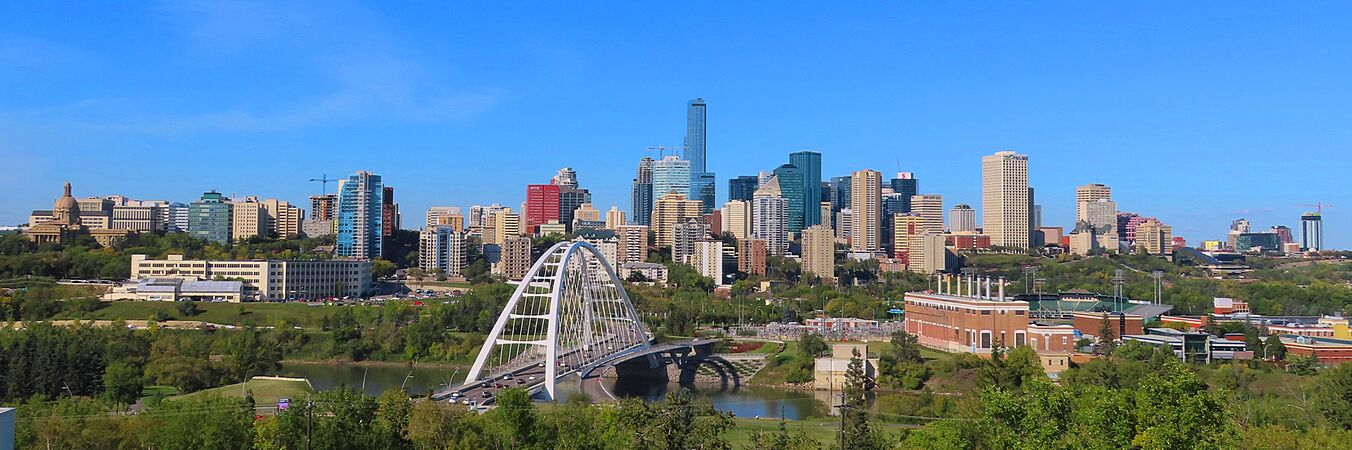
Edmonton (2019)
-
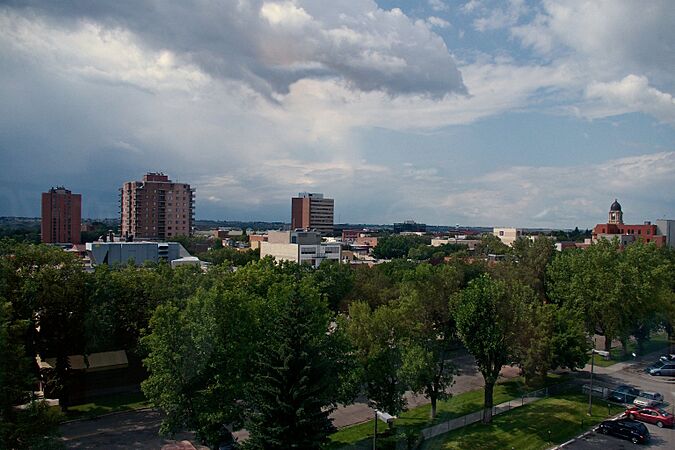
Lethbridge (2009)
-
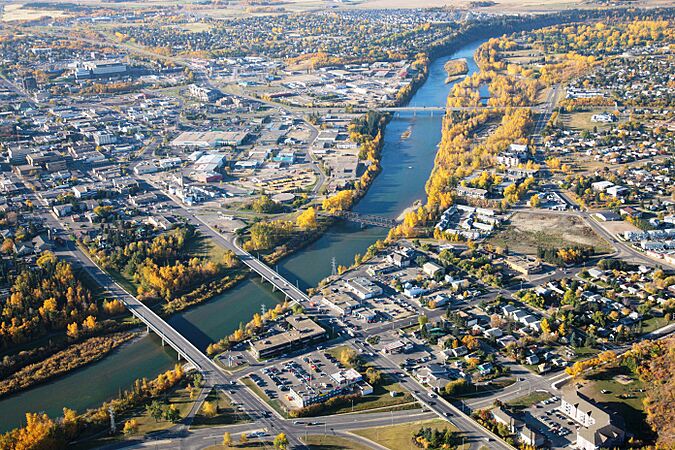
Red Deer (2008)
-
St. Albert (2009)
-
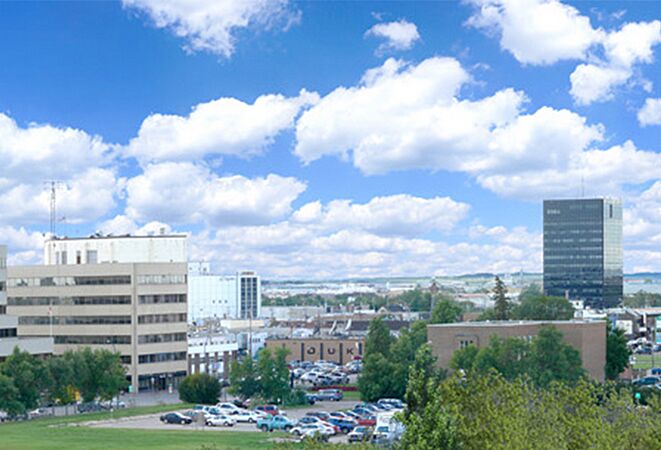
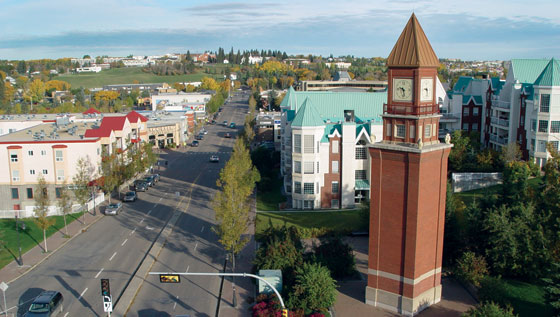
Grande Prairie (2014)


Cities in Alberta
Here is a list of the cities in Alberta:
| Name | Region | Became a city date |
Council size |
2021 Population Count | ||||
|---|---|---|---|---|---|---|---|---|
| Population (2021) |
Population (2016) |
Change (%) |
Land area (km2) |
Population density (people per km2) |
||||
| Airdrie | Calgary Metro | Jan 1, 1985 | 7 | 74,100 | 61,581 | +20.3% | 84.39 | [convert: invalid number] |
| Beaumont | Edmonton Metro | Jan 1, 2019 | 7 | 20,888 | 17,457 | +19.7% | 24.70 | [convert: invalid number] |
| Brooks | Southern | Sep 1, 2005 | 7 | 14,924 | 14,451 | +3.3% | 18.21 | [convert: invalid number] |
| Calgary | Calgary Metro | Jan 1, 1894 | 15 | 1,306,784 | 1,239,220 | +5.5% | 820.62 | [convert: invalid number] |
| Camrose | Central | Jan 1, 1955 | 9 | 18,772 | 18,742 | +0.2% | 41.67 | [convert: invalid number] |
| Chestermere | Calgary Metro | Jan 1, 2015 | 7 | 22,163 | 19,887 | +11.4% | 32.83 | [convert: invalid number] |
| Cold Lake | North | Oct 1, 2000 | 7 | 15,661 | 14,976 | +4.6% | 66.61 | [convert: invalid number] |
| Edmonton | Edmonton Metro | Oct 8, 1904 | 13 | 1,010,899 | 933,088 | +8.3% | 765.61 | [convert: invalid number] |
| Fort Saskatchewan | Edmonton Metro | Jul 1, 1985 | 7 | 27,088 | 24,169 | +12.1% | 56.50 | [convert: invalid number] |
| Grande Prairie | Northern | Jan 1, 1958 | 9 | 64,141 | 63,166 | +1.5% | 132.71 | [convert: invalid number] |
| Lacombe | Central | Sep 5, 2010 | 7 | 13,396 | 13,057 | +2.6% | 20.59 | [convert: invalid number] |
| Leduc | Edmonton Metro | Sep 1, 1983 | 7 | 34,094 | 29,993 | +13.7% | 42.25 | [convert: invalid number] |
| Lethbridge | Southern | May 9, 1906 | 9 | 98,406 | 92,729 | +6.1% | 121.12 | [convert: invalid number] |
| Lloydminster (part) | Central | Jan 1, 1958 | 7 | 19,739 | 19,645 | +0.5% | 23.98 | [convert: invalid number] |
| Medicine Hat | Southern | May 9, 1906 | 9 | 63,271 | 63,260 | 0.0% | 111.97 | [convert: invalid number] |
| Red Deer | Central | Mar 25, 1913 | 9 | 100,844 | 100,418 | +0.4% | 104.34 | [convert: invalid number] |
| Spruce Grove | Edmonton Metro | Mar 1, 1986 | 7 | 37,645 | 34,108 | +10.4% | 37.52 | [convert: invalid number] |
| St. Albert | Edmonton Metro | Jan 1, 1977 | 7 | 68,232 | 65,589 | +4.0% | 47.84 | [convert: invalid number] |
| Wetaskiwin | Central | May 9, 1906 | 7 | 12,594 | 12,655 | −0.5% | 18.75 | [convert: invalid number] |
| Total cities | — | — | 157 | 3,023,641 | 2,838,191 | +6.5% | 2,572.21 | [convert: invalid number] |
Past Cities
Alberta has had three other cities in its history that are no longer cities today.
- The Town of Strathcona became a city in 1907. But it later joined with Edmonton in 1912.
- Fort McMurray became a city in 1980. However, it changed back to an "urban service area" in 1995 when it joined with a larger district.
- The Town of Drumheller became a city in 1930. This was before the rule that a city needed 10,000 people. Drumheller changed back to a town in 1998 when it joined with the nearby Municipal District of Badlands No. 7.
| Former city | Became a city date |
What it was before |
Date of change |
What it became after |
|---|---|---|---|---|
| Drumheller | April 3, 1930 | Town | January 1, 1998 | Town |
| Fort McMurray | September 1, 1980 | New town | April 1, 1995 | Urban service area |
| Strathcona | March 15, 1907 | Town | February 1, 1912 | Joined Edmonton (City) |
Communities That Could Become Cities
Some towns in Alberta are big enough to become cities, but they haven't yet. These towns have populations over 10,000 people. They include Blackfalds, Canmore, Cochrane, High River, Morinville, Okotoks, Stony Plain, Strathmore, and Sylvan Lake. The Town of Hinton is also interested in becoming a city once its population reaches 10,000. In 2021, Hinton had 9,817 people.
Alberta also has two "urban service areas" that could become cities: Fort McMurray and Sherwood Park. As mentioned before, Fort McMurray used to be a city. Sherwood Park has always been a hamlet (a small community). In 1987, most people in Strathcona County voted to keep Sherwood Park and the rural parts of the county under one government.
| Name | Region | Current Status | 2021 Population Count | ||||
|---|---|---|---|---|---|---|---|
| Population (2021) |
Population (2016) |
Change (%) |
Land area (km2) |
Population density (people per km2) |
|||
| Blackfalds | Central | Town | 10,470 | 9,328 | +12.2% | 16.58 | 631.4 |
| Canmore | Rocky Mountains | Town | 15,990 | 13,992 | +14.3% | 68.47 | 233.5 |
| Cochrane | Calgary Metro | Town | 32,199 | 25,853 | +24.5% | 31.58 | 1,019.5 |
| Fort McMurray | Northern | Urban Service Area | 68,002 | 67,123 | +1.3% | 52.17 | 1,303.5 |
| High River | Calgary Metro | Town | 14,324 | 13,594 | +5.4% | 22.19 | 645.4 |
| Morinville | Edmonton Metro | Town | 10,385 | 9,848 | +5.5% | 11.15 | 931.0 |
| Okotoks | Calgary Metro | Town | 30,405 | 29,016 | +4.8% | 38.55 | 788.7 |
| Sherwood Park | Edmonton Metro | Urban Service Area | 73,000 | 71,332(2018) | +3.5% | ||
| Stony Plain | Edmonton Metro | Town | 17,993 | 17,189 | +4.7% | 35.45 | 507.6 |
| Strathmore | Calgary Metro | Town | 14,339 | 13,756 | +4.2% | 26.98 | 531.5 |
| Sylvan Lake | Central | Town | 15,995 | 14,816 | +8.0% | 23.09 | 692.8 |
See also
- List of census divisions of Alberta
- List of communities in Alberta
- List of hamlets in Alberta
- List of municipal districts in Alberta
- List of municipalities in Alberta
- List of population centres in Alberta
- List of summer villages in Alberta
- List of towns in Alberta
- List of villages in Alberta
Towns
Towns are smaller than cities but still have a lot of people. To become a town, an area needs at least 1,000 people. Like cities, most buildings must be on smaller land plots.
If a town grows to more than 10,000 people, it can choose to become a city. But it doesn't have to! Some towns keep their town status even if their population drops below 1,000. This is because they were towns before the current rules were made.
Alberta has 107 towns. In 2019, about 466,470 people lived in these towns.
| Top - 0-9 A B C D E F G H I J K L M N O P Q R S T U V W X Y Z |
| Name | Nearby Municipality | Became a Town | Population (2016) |
Land Area (km2) |
||
|---|---|---|---|---|---|---|
| Athabasca | Athabasca County | September 19, 1911 | 2,965 | 2,990 | −0.8% | 17.65 |
| Banff | Improvement District No. 9 (Banff) | January 1, 1990 | 7,851 | 7,584 | +3.5% | 4.77 |
| Barrhead | Barrhead No. 11, County of | November 26, 1946 | 4,579 | 4,432 | +3.3% | 8.17 |
| Bashaw | Camrose County | May 1, 1964 | 830 | 873 | −4.9% | 2.99 |
| Bassano | Newell, County of | January 16, 1911 | 1,206 | 1,282 | −5.9% | 5.22 |
| Beaverlodge | Grande Prairie No. 1, County of | January 24, 1956 | 2,465 | 2,365 | +4.2% | 5.73 |
| Bentley | Lacombe County | January 1, 2001 | 1,078 | 1,073 | +0.5% | 2.24 |
| Blackfalds | Lacombe County | April 1, 1980 | 9,328 | 6,300 | +48.1% | 16.44 |
| Bon Accord | Sturgeon County | November 20, 1979 | 1,529 | 1,488 | +2.8% | 2.13 |
| Bonnyville | Bonnyville No. 87, M.D. of | February 3, 1948 | 5,975 | 6,216 | −3.9% | 14.18 |
| Bow Island | Forty Mile No. 8, County of | February 1, 1912 | 1,983 | 2,025 | −2.1% | 5.81 |
| Bowden | Red Deer County | September 1, 1981 | 1,240 | 1,241 | −0.1% | 2.8 |
| Bruderheim | Lamont County | September 17, 1980 | 1,308 | 1,155 | +13.2% | 7.12 |
| Calmar | Leduc County | January 19, 1954 | 2,228 | 1,970 | +13.1% | 4.68 |
| Canmore | Bighorn No. 8, M.D. of Kananaskis Improvement District |
June 1, 1966 | 13,992 | 12,288 | +13.9% | 69.43 |
| Cardston | Cardston County | July 2, 1901 | 3,585 | 3,580 | +0.1% | 8.59 |
| Carstairs | Mountain View County | September 1, 1966 | 4,077 | 3,442 | +18.4% | 11.92 |
| Castor | Paintearth No. 18, County of | June 27, 1910 | 929 | 932 | −0.3% | 2.63 |
| Claresholm | Willow Creek No. 26, M.D. of | August 31, 1905 | 3,780 | 3,758 | +0.6% | 8.11 |
| Coaldale | Lethbridge County | January 7, 1952 | 8,215 | 7,493 | +9.6% | 7.99 |
| Coalhurst | Lethbridge County | June 1, 1995 | 2,668 | 1,978 | +34.9% | 3.11 |
| Cochrane | Rocky View County | February 15, 1971 | 25,853 | 17,580 | +47.1% | 29.83 |
| Coronation | Paintearth No. 18, County of | April 29, 1912 | 940 | 947 | −0.7% | 3.62 |
| Crossfield | Rocky View County | August 1, 1980 | 2,983 | 2,853 | +4.6% | 11.96 |
| Daysland | Flagstaff County | April 2, 1907 | 824 | 807 | +2.1% | 1.75 |
| Devon | Leduc County | February 24, 1950 | 6,578 | 6,515 | +1.0% | 14.3 |
| Diamond Valley | Foothills County | January 1, 2023 | 5,259 | 4,540 | +15.8% | 9.63 |
| Didsbury | Mountain View County | September 27, 1906 | 5,268 | 4,957 | +6.3% | 16.37 |
| Drayton Valley | Brazeau County | February 1, 1957 | 7,235 | 7,118 | +1.6% | 30.72 |
| Drumheller | Kneehill County Special Area No. 2 Starland County Wheatland County |
March 2, 1916 January 1, 1998 |
7,982 | 8,029 | −0.6% | 108.03 |
| Eckville | Lacombe County | July 1, 1966 | 1,125 | 1,125 | 0.0% | 1.6 |
| Edson | Yellowhead County | September 21, 1911 | 8,414 | 8,475 | −0.7% | 29.72 |
| Elk Point | St. Paul No. 19, County of | January 1, 1962 | 1,452 | 1,412 | +2.8% | 4.91 |
| Fairview | Fairview No. 136, M.D. of | April 25, 1949 | 2,998 | 3,162 | −5.2% | 11.36 |
| Falher | Smoky River No. 130, M.D. of | January 1, 1955 | 1,047 | 1,075 | −2.6% | 2.78 |
| Fort Macleod | Willow Creek No. 26, M.D. of | March 29, 1912 | 2,967 | 3,117 | −4.8% | 23.41 |
| Fox Creek | Greenview No. 16, M.D. of | September 1, 1983 | 1,971 | 1,969 | +0.1% | 12.36 |
| Gibbons | Sturgeon County | April 1, 1977 | 3,159 | 3,030 | +4.3% | 7.5 |
| Grimshaw | Peace No. 135, M.D. of | February 2, 1953 | 2,718 | 2,515 | +8.1% | 7.09 |
| Hanna | Special Area No. 2 | April 14, 1914 | 2,559 | 2,673 | −4.3% | 8.81 |
| Hardisty | Flagstaff County | November 9, 1910 | 554 | 639 | −13.3% | 5.13 |
| High Level | Mackenzie County | September 1, 1983 | 3,159 | 3,641 | −13.2% | 29.2 |
| High Prairie | Big Lakes County | January 10, 1950 | 2,564 | 2,600 | −1.4% | 7.22 |
| High River | Foothills No. 31, M.D. of | February 12, 1906 | 13,584 | 12,930 | +5.1% | 21.39 |
| Hinton | Yellowhead County | December 29, 1958 | 9,882 | 9,640 | +2.5% | 33.52 |
| Innisfail | Red Deer County | November 20, 1903 | 7,847 | 7,876 | −0.4% | 19.4 |
| Irricana | Rocky View County | June 9, 2005 | 1,216 | 1,162 | +4.6% | 3.23 |
| Killam | Flagstaff County | May 1, 1965 | 989 | 981 | +0.8% | 6.75 |
| Lamont | Lamont County | May 31, 1968 | 1,774 | 1,753 | +1.2% | 9.2 |
| Legal | Sturgeon County | January 1, 1998 | 1,345 | 1,225 | +9.8% | 3.18 |
| Magrath | Cardston County | July 24, 1907 | 2,374 | 2,217 | +7.1% | 5.99 |
| Manning | Northern Lights, County of | January 1, 1957 | 1,183 | 1,164 | +1.6% | 4.05 |
| Mayerthorpe | Lac Ste. Anne County | March 20, 1961 | 1,320 | 1,398 | −5.6% | 4.37 |
| McLennan | Smoky River No. 130, M.D. of | February 11, 1948 | 701 | 809 | −13.3% | 3.71 |
| Milk River | Warner No. 5, County of | February 7, 1956 | 827 | 811 | +2.0% | 2.33 |
| Millet | Wetaskiwin No. 10, County of | September 1, 1983 | 1,945 | 2,092 | −7.0% | 3.72 |
| Morinville | Sturgeon County | April 21, 1911 | 9,848 | 8,569 | +14.9% | 11.15 |
| Mundare | Lamont County | January 4, 1951 | 852 | 855 | −0.4% | 4.21 |
| Nanton | Willow Creek No. 26, M.D. of | August 9, 1907 | 2,181 | 2,132 | +2.3% | 4.87 |
| Nobleford | Lethbridge County | February 28, 2018 | 1,278 | 1,000 | +27.8% | 1.59 |
| Okotoks | Foothills No. 31, M.D. of | June 1, 1904 | 28,881 | 24,511 | +17.8% | 19.63 |
| Olds | Mountain View County | July 1, 1905 | 9,184 | 8,235 | +11.5% | 14.93 |
| Onoway | Lac Ste. Anne County | September 1, 2005 | 1,029 | 1,039 | −1.0% | 3.32 |
| Oyen | Special Area No. 3 | September 1, 1965 | 1,001 | 973 | +2.9% | 5.28 |
| Peace River | Northern Lights, County of Northern Sunrise County Peace No. 135, M.D. of |
December 1, 1919 | 6,842 | 6,729 | +1.7% | 26.26 |
| Penhold | Red Deer County | September 1, 1980 | 3,277 | 2,375 | +38.0% | 5.29 |
| Picture Butte | Lethbridge County | January 1, 1960 | 1,810 | 1,650 | +9.7% | 2.85 |
| Pincher Creek | Pincher Creek No. 9, M.D. of | May 12, 1906 | 3,642 | 3,685 | −1.2% | 10.09 |
| Ponoka | Ponoka County | October 15, 1904 | 7,229 | 6,778 | +6.7% | 17.33 |
| Provost | Provost No. 52, M.D. of | December 29, 1952 | 1,998 | 2,041 | −2.1% | 4.72 |
| Rainbow Lake | Mackenzie County | September 1, 1995 | 795 | 870 | −8.6% | 10.76 |
| Raymond | Warner No. 5, County of | July 1, 1903 | 3,708 | 3,743 | −0.9% | 6.66 |
| Redcliff | Cypress County | August 5, 1912 | 5,600 | 5,588 | +0.2% | 16.25 |
| Redwater | Sturgeon County | December 31, 1950 | 2,053 | 1,915 | +7.2% | 20.03 |
| Rimbey | Ponoka County | December 13, 1948 | 2,567 | 2,378 | +7.9% | 11.4 |
| Rocky Mountain House | Clearwater County | August 31, 1939 | 6,635 | 6,933 | −4.3% | 12.71 |
| Sedgewick | Flagstaff County | May 1, 1966 | 811 | 857 | −5.4% | 2.72 |
| Sexsmith | Grande Prairie No. 1, County of | October 15, 1979 | 2,620 | 2,418 | +8.4% | 13.24 |
| Slave Lake | Lesser Slave River No. 124, M.D. of | August 2, 1965 | 6,651 | 6,782 | −1.9% | 14.44 |
| Smoky Lake | Smoky Lake County | February 1, 1962 | 964 | 1,022 | −5.7% | 4.26 |
| Spirit River | Spirit River No. 133, M.D. of | September 18, 1951 | 995 | 1,025 | −2.9% | 3.14 |
| St. Paul | St. Paul No. 19, County of | December 15, 1936 | 5,827 | 5,405 | +7.8% | 8.64 |
| Stavely | Willow Creek No. 26, M.D. of | May 25, 1912 | 541 | 505 | +7.1% | 1.83 |
| Stettler | Stettler No. 6, County of | November 23, 1906 | 5,952 | 5,748 | +3.5% | 13.14 |
| Stony Plain | Parkland County | December 10, 1908 | 17,189 | 15,051 | +14.2% | 35.72 |
| Strathmore | Wheatland County | July 6, 1911 | 13,756 | 12,305 | +11.8% | 27.4 |
| Sundre | Mountain View County | January 1, 1956 | 2,729 | 2,610 | +4.6% | 11.11 |
| Swan Hills | Big Lakes County | January 1, 1967 | 1,301 | 1,465 | −11.2% | 26.12 |
| Sylvan Lake | Red Deer County | May 20, 1946 | 14,816 | 12,362 | +19.9% | 23.36 |
| Taber | Taber, M.D. of | July 1, 1907 | 8,428 | 8,104 | +4.0% | 15.67 |
| Thorsby | Leduc County | January 1, 2017 | 985 | 951 | +3.6% | 3.85 |
| Three Hills | Kneehill County | January 1, 1929 | 3,212 | 3,198 | +0.4% | 6.75 |
| Tofield | Beaver County | September 10, 1909 | 2,081 | 2,182 | −4.6% | 8.21 |
| Trochu | Kneehill County | August 1, 1962 | 1,058 | 1,072 | −1.3% | 2.78 |
| Two Hills | Two Hills No. 21, County of | January 1, 1955 | 1,352 | 1,379 | −2.0% | 3.38 |
| Valleyview | Greenview No. 16, M.D. of | February 5, 1957 | 1,863 | 1,761 | +5.8% | 9.32 |
| Vauxhall | Taber, M.D. of | January 1, 1961 | 1,222 | 1,288 | −5.1% | 2.72 |
| Vegreville | Minburn No. 27, County of | August 15, 1906 | 5,708 | 5,717 | −0.2% | 14.08 |
| Vermilion | Vermilion River, County of | August 27, 1906 | 4,084 | 3,930 | +3.9% | 12.93 |
| Viking | Beaver County | November 10, 1952 | 1,083 | 1,041 | +4.0% | 3.7 |
| Vulcan | Vulcan County | June 15, 1921 | 1,917 | 1,836 | +4.4% | 6.34 |
| Wainwright | Wainwright No. 61, M.D. of | July 14, 1910 | 6,270 | 5,925 | +5.8% | 9.1 |
| Wembley | Grande Prairie No. 1, County of | August 1, 1980 | 1,516 | 1,383 | +9.6% | 4.75 |
| Westlock | Westlock County | January 7, 1947 | 5,101 | 4,823 | +5.8% | 13.37 |
| Whitecourt | Woodlands County | December 20, 1971 | 10,204 | 9,605 | +6.2% | 26.44 |
| Total towns | — | — | 454,181 | 420,498 | +8.0% | 1,248.01 |
Villages
Villages are smaller urban communities. To become a village, an area needs at least 300 people. Most of its buildings should be on smaller pieces of land.
If a village grows to more than 1,000 people, it can apply to become a town. But this is not required. Like towns, some villages keep their status even if their population falls below 300. This is often because they were villages before the current rules.
Alberta has 81 villages. In 2021, about 34,600 people lived in these villages. List of villages in Alberta
Summer Villages
Summer villages were special places often used for vacations. They had at least 60 homes, but fewer than 300 permanent residents. Most people living there were not year-round residents.
New summer villages can no longer be created in Alberta. This is because the law that allowed them was changed. If a summer village grows to more than 300 people, it can become a regular village.
Alberta has 51 summer villages. In 2019, about 5,200 people lived in them.
Specialized Communities
Specialized municipalities are unique. They are created when the usual types of local government (like city or town) don't quite fit. The government of Alberta decides if an area should become a specialized municipality. This helps make sure these unique places are governed well.
Alberta has six specialized municipalities. In 2019, about 242,395 people lived in them. List of specialized municipalities in Alberta
Rural Communities
Rural communities are large areas with fewer people living close together. People in these areas often live on farms or in small, spread-out communities.
Municipal Districts
Municipal districts are large rural areas. Most homes in these areas are on bigger pieces of land. To become a municipal district, an area needs at least 1,000 people.
In Alberta, a "municipal district" is the same as a "county." Many municipal districts choose to call themselves "counties" because the name is more familiar. Over the years, many have changed their names to include "County." This makes them sound more traditional and can help with economic growth.
Alberta has 63 municipal districts. In 2019, about 471,852 people lived in them.
A municipal district (often called an MD) is a type of local government area in Alberta, Canada. It's the most common way that rural areas in Alberta are organized. Most municipal districts are mostly countryside, with farms, forests, or open land. They can also include small communities called hamletsor other unincorporated communities. To become a municipal district, an area usually needs at least 1,000 people. Most homes in these areas are on larger pieces of land. The local government applies to Alberta Municipal Affairs, which is a part of the provincial government. If approved, the Lieutenant Governor in Council (a representative of the King) officially creates the municipal district. In 2011, Alberta had 64 municipal districts. Together, they had about 451,979 people. The average population for a municipal district was around 7,062 people. The largest in population was Rocky View County, and the smallest was the MD of Ranchland No. 66. About 437 elected officials help run these municipal districts. These include mayors, reeves, and councillors. They make decisions for their local communities.
What's in a Name?
When a municipal district is officially created, it gets a name. Out of Alberta's 63 municipal districts, 16 still have "municipal district" in their official names. However, 47 of them use the word "county" in their names, like Yellowhead County. Some also have a number, such as "No. 8".
Many people think that "county" is a separate type of municipality in Alberta. But it's not! It's just a name that many municipal districts use. This is because "county" used to be a different type of local government in Alberta. When the old "County Act" was changed, these areas became municipal districts but were allowed to keep "county" in their names.
Where are the Offices?
It might seem strange, but many municipal districts have their main offices outside their own area. More than half of the 63 municipal districts have their offices in a nearby city, town, or village. These cities, towns, or villages are separate from the municipal district's control.
However, some municipal districts do have their offices within their own boundaries. For example:
- Nine municipal districts have their offices in a hamlet that is part of their district. These include Acadia in Acadia Valley and Birch Hills in Wanham.
- One municipal district, Ranchland, has its office in a provincial park called Chain Lakes Provincial Park.
- Thirteen municipal districts have their offices in their own area, but not inside a city, town, or village. Examples include Brazeau near Drayton Valley and Red Deer County near Red Deer.
How Municipal Districts Change
Over time, some municipal districts in Alberta have changed their status or even dissolved. This means they either became a different type of municipality or their land was absorbed into other areas.
For example, Lac La Biche County, Mackenzie County, and Strathcona County used to be municipal districts. They later became "specialized municipalities," which is another type of local government in Alberta.
Many other municipal districts have dissolved over the years. Their land was then added to existing municipal districts or new ones that were created. This shows how the map of local governments in Alberta has changed over time.
Images
-
Territorial evolution of Alberta's municipalities from 1955 to 2024

Improvement Districts
Improvement districts are special areas, often found within national or provincial parks. The government of Alberta creates and manages these districts. Their boundaries usually match the park boundaries.
Alberta has seven improvement districts. Their combined population is about 2,146 people. Five are in national parks, and two are in provincial parks.
| Name | Incorporation date (improvement district) |
Population (2011) |
Population (2006) |
Change (%) | Land area (km2) |
Population density (per km2) |
Remarks |
|---|---|---|---|---|---|---|---|
| Improvement District No. 4 (Waterton) | January 1, 1944 | 88 | 160 | -45.0 | 480.58 | 0.18 | Coincident with Waterton Lakes National Park |
| Improvement District No. 9 (Banff) | April 1, 1945 | 1,175 | 938 | 25.3 | 6,782.23 | 0.17 | Coincident with Banff National Park excluding the Town of Banff |
| Improvement District No. 12 (Jasper National Park) | April 1, 1945 | 34 | 24 | 41.7 | 10,181.58 | 0.003 | Coincident with Jasper National Park excluding the Municipality of Jasper |
| Improvement District No. 13 (Elk Island) | April 1, 1958 | 10 | 21 | -52.4 | 165.28 | 0.06 | Coincident with Elk Island National Park |
| Improvement District No. 24 (Wood Buffalo) | January 1, 1967 | 590 | 422 | 39.8 | 33,412.25 | 0.02 | Coincident with the Alberta portion of Wood Buffalo National Park excluding Peace Point 222 |
| Improvement District No. 25 (Willmore Wilderness) | January 2, 1994 | 0 | 0 | — | 4,604.97 | 0.0 | Coincident with Willmore Wilderness Park |
| Kananaskis Improvement District | January 1, 1983 | 249 | 429 | -42.0 | 4,210.72 | 0.06 | Consists mostly of Kananaskis Country |
| Total improvement districts | — | 2,463 | 1,994 | 7.6 | 65,642.17 | 0.03 | — |
Special Areas
Special areas are rural municipalities created in 1938. They are different from specialized municipalities. These areas were set up under a special law called the Special Areas Act.
Alberta has three special areas. In 2016, about 4,184 people lived in them.
| Special area | Incorporation date (special area) |
Population (2016) |
Population (2011) |
Change (%) | Area (km2) | Population density (/km2) |
|---|---|---|---|---|---|---|
| Special Area No. 2 | April 7, 1959 | 1,905 | 2,025 | -5.9 | 9,347.57 | 0.20 |
| Special Area No. 3 | April 7, 1959 | 1,042 | 1,122 | -7.1 | 6,625.58 | 0.16 |
| Special Area No. 4 | January 1, 1969 | 1,237 | 1,352 | -8.5 | 4,402.64 | 0.28 |
| Total special areas | — | 4,184 | 4,499 | -7.0 | 20,375.79 | 0.21 |
Unincorporated Communities
Unincorporated communities are places that are not independent municipalities. They are part of a larger municipal district or specialized municipality.
Urban Service Areas
Urban service areas are like very large hamlets. They are not officially cities, but they are treated like cities for some government programs and funding. This means they get similar services and support.
There are two urban service areas in Alberta:
Fort McMurray used to be a city. Sherwood Park has always been an unincorporated community.
Hamlets
Hamlets are unincorporated communities. They have at least five homes, and most buildings are on smaller pieces of land. They also have a known name and boundaries. Hamlets often have some non-residential buildings, like shops.
Local governments can decide to name communities within their area as hamlets. If a hamlet grows to 300 people, it can become a village. However, this doesn't happen very often anymore. It's more common for villages to become hamlets if their population shrinks.
Alberta has 403 hamlets, including the two urban service areas.
Townsites
A townsite is an unincorporated community found within an Indian reserve. It's like a small town, with similar population, size, and services. But because it's on an Indian reserve, it's under federal (national) government rules, not provincial ones.
Redwood Meadows is Alberta's only townsite. It is located within the Tsuutʼina Nation.
Métis Settlements
Métis settlements are rural areas where the indigenous Métis people live. They were created in 1936 to provide a land base for the Métis. This helps them access education, health services, and economic opportunities. These settlements are governed by the Métis Settlements General Council.
Alberta has eight Métis settlements, all in the northern part of the province.
In 2018, about 5,632 people lived in Alberta's Métis settlements.
Indian Reserves
Indian reserves are lands set aside for First Nations people in Canada. In Alberta, these reserves cover a large area. The Canadian government is in charge of laws for Indian reserves. However, the local band governments, elected by the people living on the reserve, manage the day-to-day activities.
| Name of Reserve or Settlement | First Nation(s) | Main Ethnic Group | Treaty | Area | Population | Notes | |||
|---|---|---|---|---|---|---|---|---|---|
| ha | acre | 2016 | 2011 | % difference |
|||||
| Alexander 134 | Alexander | Beaver Hills Cree | 6 | 7,280.5 | 17,990.5 | 1,099 | 1,027 | 7.0% | |
| Blood 148 | Blood | Blackfoot Confederacy | 7 | 134,292.9 | 331,845.0 | 4,570 | 4,679 | -2.3% | |
| Bushe River 207 | Dene Tha' | Slavey | 8 | 111,675.0 | 275,954.9 | 503 | 492 | 2.2% | |
| Cold Lake 149 | Cold Lake | Chipewyan | 6 | 14,528.1 | 35,899.7 | 671 | 594 | 13.0% | |
| Drift Pile River 150 | Driftpile Cree | Cree | 8 | 6,354.8 | 15,703.1 | 828 | 800 | 3.5% | |
| Enoch Cree Nation 135 | Enoch Cree | Beaver Hills Cree | 6 | 5,306.2 | 13,111.9 | 1,690 | 987 | 71.2% | Was Stony Plain 135 |
| Ermineskin 138 | Ermineskin Tribe | Cree | 6 | 10,295.8 | 25,441.5 | 2,457 | 1,874 | 31.1% | |
| Fox Lake 162 | Little Red River Cree | Woods Cree | 8 | 10,438.3 | 25,793.6 | 2,032 | 1,875 | 8.4% | |
| Hay Lake 209 | Dene Tha' | Slavey | 8 | 12,355.3 | 30,530.6 | 883 | 949 | -7.0% | |
| John D'Or Prairie 215 | Little Red River Cree | Woods Cree | 8 | 14,034.0 | 34,678.8 | 1,196 | 1,123 | 6.5% | |
| Kehewin 123 | Kehewin Cree | Cree | 6 | 8,225.0 | 20,324.4 | 976 | 1,065 | -8.4% | |
| Louis Bull 138B | Louis Bull | Beaver Hills Cree | 6 | 3,388.1 | 8,372.2 | 1,177 | 1,309 | -10.1% | |
| O'Chiese 203 | O'Chiese | Anishinaabe | 6 | 14,131.9 | 34,920.7 | 789 | 751 | 5.1% | |
| PiikanI | Piikani | Piegan Blackfeet | 7 | 42,699.2 | 105,512.0 | 1,544 | 1,217 | 26.9% | |
| Puskiakiwenin 122 | Frog Lake | Cree | 6 | 10,339.1 | 25,548.5 | 531 | 484 | 9.7% | |
| Saddle Lake 125 | Saddle Lake Cree | Beaver Hills Cree | 6 | 25,780.6 | 63,705.2 | UN | UN | UN | |
| Samson 137 | Samson | Beaver Hills Cree | 6 | 13,552.0 | 33,487.7 | 3,373 | 3,746 | -10.0% | |
| Siksika 146 | Siksika | Piegan Blackfeet | 7 | 71,087.5 | 175,661.0 | 3,479 | 2,972 | 17.1% | |
| Stoney 142-143-144 | Bearspaw Chiniki Stoney Wesley |
Nakoda | 7 | 39,264.5 | 97,024.7 | 3,713 | 3,494 | 6.3% | |
| Sturgeon Lake 154 | Sturgeon Lake Cree | Woods Cree | 8 | 14,814.3 | 36,606.9 | 1,447 | 1,162 | 24.5% | |
| Sunchild 202 | Sunchild | Beaver Hills Cree | 6 | 5,218.1 | 12,894.2 | 749 | 677 | 10.6% | |
| Tsuu T'ina Nation 145 | Tsuut'ina | Dene | 7 | 29,417.4 | 72,692.0 | 1,643 | 2,052 | -19.9% | |
| Unipouheos 121 | Frog Lake | Cree | 6 | 8,506.3 | 21,019.5 | 909 | 813 | 11.8% | |
| Wabamun 133A | Paul | Cree / Nakoda | 6 | 6,116.9 | 15,115.2 | 1,592 | 1,069 | 48.9% | |
| White Fish Lake 128 | Saddle Lake Cree | Beaver Hills Cree | 6 | 4,542.7 | 11,225.3 | 1,310 | 1,188 | 10.3% | |
More About Alberta's Communities

- List of census divisions of Alberta
- List of designated places in Alberta
- List of municipalities in Alberta
