
List of cities in Alaska facts for kids
.svg)
Alaska is a huge state in the United States, located at the very northwest tip of North America. Even though it's the largest state by land area, it has one of the smallest populations. In 2020, about 733,391 people lived there. Alaska is so big that it's divided into 19 "organized boroughs" and one "Unorganized Borough." Think of boroughs like counties in other states. The Unorganized Borough is then split into 11 "census areas."
Alaska has 149 official cities. These cities cover only a small part of Alaska's total land, but most of the state's people live in them. Some cities are very large, like four "unified home rule municipalities" that are both boroughs and cities. Each of these is bigger than 1,700 square miles! Only two other cities are larger than 100 square miles: Unalaska, which has the important fishing port of Dutch Harbor, and Valdez, where the Trans-Alaska Pipeline System ends.
Contents
How Cities in Alaska Work
Cities in Alaska are grouped into two main types: "general law" cities and "home rule" cities. General law cities are then split into "first class" and "second class." Both general law and home rule cities have similar powers. They can make most laws as long as they don't go against state laws.
The jobs of local cities can be very different. They always have to do things like hold elections and have regular meetings. Home rule cities and first class cities in the unorganized areas must also run their own school districts and manage land use. In organized boroughs, the borough usually handles these tasks unless the city asks to do them. Unified home rule cities and other boroughs also collect property and sales taxes for their areas.
To become a home rule city, a community needs to set up a special group to write a plan, which then has to be approved by voters. Alaska law says a community must have at least 400 permanent residents to become a home rule or first class city. If a city's population drops below 400 later, it still keeps its status. For example, the city of Nenana and four first class cities (Hydaburg, Pelican, Seldovia, and Tanana) had fewer than 400 people in 2010 but kept their city status.
Alaska's Biggest and Smallest Cities
Anchorage is the largest city in Alaska by population. It has about 291,247 residents, which is almost half of the state's total population! The smallest city by population is Kupreanof, with only 21 people.
When it comes to land area, Sitka is the largest city, covering about 2,870 square miles. On the other hand, Kiana is the smallest, at just 0.19 square miles. The very first city to become official in Alaska was Ketchikan in 1901. The newest city is Whale Pass, which became a city in 2017.
Incorporated cities
- Largest cities in Alaska by population
-
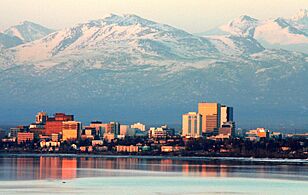
Skyline of Anchorage, Alaska's largest city by population
-
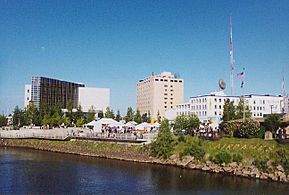
Downtown Fairbanks, the second largest city in Alaska by population
-
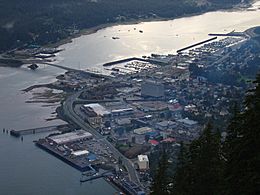
Aerial view of Juneau, Alaska's capital and third largest city by population
-
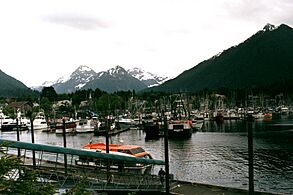
Harbor of Sitka, the fifth largest city by population in Alaska and largest by land area
-
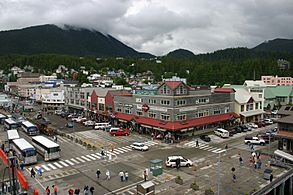
Downtown Ketchikan, the earliest extant incorporated city and sixth largest city by population in Alaska


| Name | Class | Borough or Census Area | Incorporated | Population (2020) |
Population (2010) |
Change | Land area (2020) |
Population density | |
|---|---|---|---|---|---|---|---|---|---|
| sq mi | km2 | ||||||||
| Adak | Second Class | Aleutians West (CA) | 2001 | 171 | 326 | −47.5% | 32.43 | 84.0 | 5.3/sq mi (2.0/km2) |
| Akhiok | Second Class | Kodiak Island | 1974 | 63 | 71 | −11.3% | 7.40 | 19.2 | 8.5/sq mi (3.3/km2) |
| Akiak | Second Class | Bethel (CA) | 1970 | 462 | 346 | +33.5% | 1.89 | 4.9 | 244.4/sq mi (94.4/km2) |
| Akutan | Second Class | Aleutians East | 1979 | 1,589 | 1,027 | +54.7% | 65.98 | 170.9 | 24.1/sq mi (9.3/km2) |
| Alakanuk | Second Class | Kusilvak (CA) | 1969 | 756 | 677 | +11.7% | 32.20 | 83.4 | 23.5/sq mi (9.1/km2) |
| Aleknagik | Second Class | Dillingham (CA) | 1973 | 211 | 219 | −3.7% | 26.55 | 68.8 | 7.9/sq mi (3.1/km2) |
| Allakaket | Second Class | Yukon-Koyukuk (CA) | 1975 | 177 | 105 | +68.6% | 14.72 | 38.1 | 12.0/sq mi (4.6/km2) |
| Ambler | Second Class | Northwest Arctic | 1971 | 274 | 258 | +6.2% | 10.28 | 26.6 | 26.7/sq mi (10.3/km2) |
| Anaktuvuk Pass | Second Class | North Slope | 1959 | 425 | 324 | +31.2% | 5.18 | 13.4 | 82.0/sq mi (31.7/km2) |
| Anchorage | Unified Home Rule | Anchorage | 1975 | 291,247 | 291,826 | −0.2% | 1,706.80 | 4,420.6 | 170.6/sq mi (65.9/km2) |
| Anderson | Second Class | Denali | 1962 | 177 | 246 | −28.0% | 42.20 | 109.3 | 4.2/sq mi (1.6/km2) |
| Angoon | Second Class | Hoonah-Angoon (CA) | 1963 | 357 | 459 | −22.2% | 24.53 | 63.5 | 14.6/sq mi (5.6/km2) |
| Aniak | Second Class | Bethel (CA) | 1972 | 507 | 501 | +1.2% | 6.18 | 16.0 | 82.0/sq mi (31.7/km2) |
| Anvik | Second Class | Yukon-Koyukuk (CA) | 1969 | 70 | 85 | −17.6% | 9.49 | 24.6 | 7.4/sq mi (2.9/km2) |
| Atka | Second Class | Aleutians West (CA) | 1988 | 53 | 61 | −13.1% | 8.47 | 21.9 | 6.3/sq mi (2.4/km2) |
| Atqasuk | Second Class | North Slope | 1982 | 276 | 233 | +18.5% | 39.12 | 101.3 | 7.1/sq mi (2.7/km2) |
| Bethel | Second Class | Bethel (CA) | 1957 | 6,325 | 6,080 | +4.0% | 44.51 | 115.3 | 142.1/sq mi (54.9/km2) |
| Bettles | Second Class | Yukon-Koyukuk (CA) | 1985 | 23 | 12 | +91.7% | 1.56 | 4.0 | 14.7/sq mi (5.7/km2) |
| Brevig Mission | Second Class | Nome (CA) | 1969 | 428 | 388 | +10.3% | 2.43 | 6.3 | 176.1/sq mi (68.0/km2) |
| Buckland | Second Class | Northwest Arctic | 1966 | 550 | 416 | +32.2% | 0.85 | 2.2 | 647.1/sq mi (249.8/km2) |
| Chefornak | Second Class | Bethel (CA) | 1974 | 506 | 418 | +21.1% | 5.24 | 13.6 | 96.6/sq mi (37.3/km2) |
| Chevak | Second Class | Kusilvak (CA) | 1967 | 951 | 938 | +1.4% | 1.14 | 3.0 | 834.2/sq mi (322.1/km2) |
| Chignik | Second Class | Lake and Peninsula | 1983 | 97 | 91 | +6.6% | 10.95 | 28.4 | 8.9/sq mi (3.4/km2) |
| Chuathbaluk | Second Class | Bethel (CA) | 1975 | 104 | 118 | −11.9% | 4.47 | 11.6 | 23.3/sq mi (9.0/km2) |
| Clark's Point | Second Class | Dillingham (CA) | 1971 | 67 | 62 | +8.1% | 3.32 | 8.6 | 20.2/sq mi (7.8/km2) |
| Coffman Cove | Second Class | Prince of Wales-Hyder (CA) | 1989 | 127 | 176 | −27.8% | 10.90 | 28.2 | 11.7/sq mi (4.5/km2) |
| Cold Bay | Second Class | Aleutians East | 1981 | 50 | 108 | −53.7% | 53.41 | 138.3 | 0.9/sq mi (0.35/km2) |
| Cordova | Home Rule | Chugach (CA) | 1909 | 2,609 | 2,239 | +16.5% | 61.35 | 158.9 | 42.5/sq mi (16.4/km2) |
| Craig | First Class | Prince of Wales-Hyder (CA) | 1922 | 1,036 | 1,201 | −13.7% | 6.69 | 17.3 | 154.9/sq mi (59.8/km2) |
| Deering | Second Class | Northwest Arctic | 1970 | 182 | 122 | +49.2% | 5.02 | 13.0 | 36.3/sq mi (14.0/km2) |
| Delta Junction | Second Class | Southeast Fairbanks (CA) | 1960 | 918 | 958 | −4.2% | 13.88 | 35.9 | 66.1/sq mi (25.5/km2) |
| Dillingham | First Class | Dillingham (CA) | 1963 | 2,249 | 2,329 | −3.4% | 33.34 | 86.4 | 67.5/sq mi (26.1/km2) |
| Diomede | Second Class | Nome (CA) | 1970 | 83 | 115 | −27.8% | 2.43 | 6.3 | 34.2/sq mi (13.2/km2) |
| Eagle | Second Class | Southeast Fairbanks (CA) | 1901 | 83 | 86 | −3.5% | 0.88 | 2.3 | 94.3/sq mi (36.4/km2) |
| Edna Bay | Second Class | Prince of Wales-Hyder (CA) | 2014 | 25 | — | — | 21.14 | 54.8 | 1.2/sq mi (0.46/km2) |
| Eek | Second Class | Bethel (CA) | 1970 | 404 | 296 | +36.5% | 0.65 | 1.7 | 621.5/sq mi (240.0/km2) |
| Egegik | Second Class | Lake and Peninsula | 1995 | 39 | 109 | −64.2% | 29.55 | 76.5 | 1.3/sq mi (0.50/km2) |
| Ekwok | Second Class | Dillingham (CA) | 1974 | 111 | 115 | −3.5% | 16.75 | 43.4 | 6.6/sq mi (2.5/km2) |
| Elim | Second Class | Nome (CA) | 1970 | 366 | 330 | +10.9% | 2.66 | 6.9 | 137.6/sq mi (53.1/km2) |
| Emmonak | Second Class | Kusilvak (CA) | 1964 | 825 | 762 | +8.3% | 4.97 | 12.9 | 166.0/sq mi (64.1/km2) |
| Fairbanks |
Home Rule | Fairbanks North Star | 1903 | 32,515 | 31,535 | +3.1% | 31.75 | 82.2 | 1,024.1/sq mi (395.4/km2) |
| False Pass | Second Class | Aleutians East | 1990 | 397 | 35 | +1,034.3% | 25.07 | 64.9 | 15.8/sq mi (6.1/km2) |
| Fort Yukon | Second Class | Yukon-Koyukuk (CA) | 1959 | 428 | 583 | −26.6% | 6.74 | 17.5 | 63.5/sq mi (24.5/km2) |
| Galena | First Class | Yukon-Koyukuk (CA) | 1971 | 472 | 470 | +0.4% | 17.65 | 45.7 | 26.7/sq mi (10.3/km2) |
| Gambell | Second Class | Nome (CA) | 1963 | 640 | 681 | −6.0% | 10.51 | 27.2 | 60.9/sq mi (23.5/km2) |
| Golovin | Second Class | Nome (CA) | 1971 | 175 | 156 | +12.2% | 4.13 | 10.7 | 42.4/sq mi (16.4/km2) |
| Goodnews Bay | Second Class | Bethel (CA) | 1970 | 258 | 243 | +6.2% | 3.33 | 8.6 | 77.5/sq mi (29.9/km2) |
| Grayling | Second Class | Yukon-Koyukuk (CA) | 1969 | 210 | 194 | +8.2% | 11.23 | 29.1 | 18.7/sq mi (7.2/km2) |
| Gustavus | Second Class | Hoonah-Angoon (CA) | 2004 | 655 | 442 | +48.2% | 36.36 | 94.2 | 18.0/sq mi (6.9/km2) |
| Holy Cross | Second Class | Yukon-Koyukuk (CA) | 1968 | 176 | 178 | −1.1% | 28.83 | 74.7 | 6.1/sq mi (2.4/km2) |
| Homer | First Class | Kenai Peninsula | 1964 | 5,522 | 5,003 | +10.4% | 13.79 | 35.7 | 400.4/sq mi (154.6/km2) |
| Hoonah | First Class | Hoonah-Angoon (CA) | 1946 | 931 | 760 | +22.5% | 5.87 | 15.2 | 158.6/sq mi (61.2/km2) |
| Hooper Bay | Second Class | Kusilvak (CA) | 1966 | 1,375 | 1,093 | +25.8% | 7.50 | 19.4 | 183.3/sq mi (70.8/km2) |
| Houston | Second Class | Matanuska-Susitna | 1966 | 1,975 | 1,912 | +3.3% | 23.94 | 62.0 | 82.5/sq mi (31.9/km2) |
| Hughes | Second Class | Yukon-Koyukuk (CA) | 1973 | 85 | 77 | +10.4% | 3.04 | 7.9 | 28.0/sq mi (10.8/km2) |
| Huslia | Second Class | Yukon-Koyukuk (CA) | 1969 | 304 | 275 | +10.5% | 15.79 | 40.9 | 19.3/sq mi (7.5/km2) |
| Hydaburg | First Class | Prince of Wales-Hyder (CA) | 1927 | 380 | 376 | +1.1% | 0.29 | 0.75 | 1,310.3/sq mi (505.9/km2) |
| Juneau |
Unified Home Rule | Juneau | 1970 | 32,255 | 31,275 | +3.1% | 2,704.03 | 7,003.4 | 11.9/sq mi (4.6/km2) |
| Kachemak | Second Class | Kenai Peninsula | 1961 | 576 | 472 | +22.0% | 1.67 | 4.3 | 344.9/sq mi (133.2/km2) |
| Kake | First Class | Prince of Wales-Hyder (CA) | 1952 | 543 | 557 | −2.5% | 7.67 | 19.9 | 70.8/sq mi (27.3/km2) |
| Kaktovik | Second Class | North Slope | 1971 | 283 | 239 | +18.4% | 0.77 | 2.0 | 367.5/sq mi (141.9/km2) |
| Kaltag | Second Class | Yukon-Koyukuk (CA) | 1969 | 158 | 190 | −16.8% | 21.64 | 56.0 | 7.3/sq mi (2.8/km2) |
| Kasaan | Second Class | Prince of Wales-Hyder (CA) | 1976 | 30 | 49 | −38.8% | 6.06 | 15.7 | 5.0/sq mi (1.9/km2) |
| Kenai | Home Rule | Kenai Peninsula | 1960 | 7,424 | 7,100 | +4.6% | 29.14 | 75.5 | 254.8/sq mi (98.4/km2) |
| Ketchikan |
Home Rule | Ketchikan Gateway | 1900 | 8,192 | 8,050 | +1.8% | 3.81 | 9.9 | 2,150.1/sq mi (830.2/km2) |
| Kiana | Second Class | Northwest Arctic | 1964 | 447 | 361 | +23.8% | 0.19 | 0.49 | 2,352.6/sq mi (908.3/km2) |
| King Cove | First Class | Aleutians East | 1947 | 757 | 938 | −19.3% | 24.66 | 63.9 | 30.7/sq mi (11.9/km2) |
| Kivalina | Second Class | Northwest Arctic | 1969 | 444 | 374 | +18.7% | 1.63 | 4.2 | 272.4/sq mi (105.2/km2) |
| Klawock | First Class | Prince of Wales-Hyder (CA) | 1929 | 720 | 755 | −4.6% | 0.68 | 1.8 | 1,058.8/sq mi (408.8/km2) |
| Kobuk | Second Class | Northwest Arctic | 1973 | 191 | 151 | +26.5% | 15.51 | 40.2 | 12.3/sq mi (4.7/km2) |
| Kodiak |
Home Rule | Kodiak Island | 1940 | 5,581 | 6,130 | −9.0% | 3.92 | 10.2 | 1,423.7/sq mi (549.7/km2) |
| Kotlik | Second Class | Kusilvak (CA) | 1970 | 655 | 577 | +13.5% | 2.99 | 7.7 | 219.1/sq mi (84.6/km2) |
| Kotzebue |
Second Class | Northwest Arctic | 1958 | 3,102 | 3,201 | −3.1% | 24.76 | 64.1 | 125.3/sq mi (48.4/km2) |
| Koyuk | Second Class | Nome (CA) | 1970 | 312 | 332 | −6.0% | 5.10 | 13.2 | 61.2/sq mi (23.6/km2) |
| Koyukuk | Second Class | Yukon-Koyukuk (CA) | 1973 | 98 | 96 | +2.1% | 5.74 | 14.9 | 17.1/sq mi (6.6/km2) |
| Kupreanof | Second Class | Petersburg | 1975 | 21 | 27 | −22.2% | 3.02 | 7.8 | 7.0/sq mi (2.7/km2) |
| Kwethluk | Second Class | Bethel (CA) | 1975 | 812 | 721 | +12.6% | 10.18 | 26.4 | 79.8/sq mi (30.8/km2) |
| Larsen Bay | Second Class | Kodiak Island | 1974 | 34 | 87 | −60.9% | 4.03 | 10.4 | 8.4/sq mi (3.2/km2) |
| Lower Kalskag | Second Class | Bethel (CA) | 1969 | 278 | 282 | −1.4% | 1.24 | 3.2 | 224.2/sq mi (86.6/km2) |
| Manokotak | Second Class | Dillingham (CA) | 1970 | 488 | 442 | +10.4% | 73.14 | 189.4 | 6.7/sq mi (2.6/km2) |
| Marshall | Second Class | Kusilvak (CA) | 1970 | 492 | 414 | +18.8% | 4.06 | 10.5 | 121.2/sq mi (46.8/km2) |
| McGrath | Second Class | Yukon-Koyukuk (CA) | 1975 | 301 | 346 | −13.0% | 42.33 | 109.6 | 7.1/sq mi (2.7/km2) |
| Mekoryuk | Second Class | Bethel (CA) | 1969 | 206 | 191 | +7.9% | 7.07 | 18.3 | 29.1/sq mi (11.2/km2) |
| Mountain Village | Second Class | Kusilvak (CA) | 1967 | 621 | 813 | −23.6% | 4.21 | 10.9 | 147.5/sq mi (57.0/km2) |
| Napakiak | Second Class | Bethel (CA) | 1970 | 358 | 354 | +1.1% | 2.01 | 5.2 | 178.1/sq mi (68.8/km2) |
| Napaskiak | Second Class | Bethel (CA) | 1971 | 509 | 405 | +25.7% | 2.90 | 7.5 | 175.5/sq mi (67.8/km2) |
| Nenana | Home Rule | Yukon-Koyukuk (CA) | 1921 | 358 | 378 | −5.3% | 5.95 | 15.4 | 60.2/sq mi (23.2/km2) |
| New Stuyahok | Second Class | Dillingham (CA) | 1972 | 512 | 510 | +0.4% | 33.72 | 87.3 | 15.2/sq mi (5.9/km2) |
| Newhalen | Second Class | Lake and Peninsula | 1971 | 168 | 190 | −11.6% | 6.03 | 15.6 | 27.9/sq mi (10.8/km2) |
| Nightmute | Second Class | Bethel (CA) | 1974 | 306 | 280 | +9.3% | 98.96 | 256.3 | 3.1/sq mi (1.2/km2) |
| Nikolai | Second Class | Yukon-Koyukuk (CA) | 1970 | 89 | 94 | −5.3% | 4.39 | 11.4 | 20.3/sq mi (7.8/km2) |
| Nome | First Class | Nome (CA) | 1901 | 3,699 | 3,598 | +2.8% | 12.80 | 33.2 | 289.0/sq mi (111.6/km2) |
| Nondalton | Second Class | Lake and Peninsula | 1971 | 133 | 164 | −18.9% | 6.74 | 17.5 | 19.7/sq mi (7.6/km2) |
| Noorvik | Second Class | Northwest Arctic | 1964 | 694 | 668 | +3.9% | 0.84 | 2.2 | 826.2/sq mi (319.0/km2) |
| North Pole | Home Rule | Fairbanks North Star | 1953 | 2,243 | 2,117 | +6.0% | 4.08 | 10.6 | 549.8/sq mi (212.3/km2) |
| Nuiqsut | Second Class | North Slope | 1975 | 512 | 402 | +27.4% | 8.89 | 23.0 | 57.6/sq mi (22.2/km2) |
| Nulato | Second Class | Yukon-Koyukuk (CA) | 1963 | 238 | 264 | −9.8% | 41.09 | 106.4 | 5.8/sq mi (2.2/km2) |
| Nunam Iqua | Second Class | Kusilvak (CA) | 1974 | 217 | 187 | +16.0% | 11.57 | 30.0 | 18.8/sq mi (7.3/km2) |
| Nunapitchuk | Second Class | Bethel (CA) | 1969 | 594 | 496 | +19.8% | 6.99 | 18.1 | 85.0/sq mi (32.8/km2) |
| Old Harbor | Second Class | Kodiak Island | 1966 | 216 | 218 | −0.9% | 16.19 | 41.9 | 13.3/sq mi (5.1/km2) |
| Ouzinkie | Second Class | Kodiak Island | 1967 | 109 | 161 | −32.3% | 5.54 | 14.3 | 19.7/sq mi (7.6/km2) |
| Palmer |
Home Rule | Matanuska-Susitna | 1951 | 5,888 | 5,937 | −0.8% | 5.07 | 13.1 | 1,161.3/sq mi (448.4/km2) |
| Pelican | First Class | Hoonah-Angoon (CA) | 1943 | 98 | 88 | +11.4% | 0.55 | 1.4 | 178.2/sq mi (68.8/km2) |
| Pilot Point | Second Class | Lake and Peninsula | 1992 | 70 | 68 | +2.9% | 24.55 | 63.6 | 2.9/sq mi (1.1/km2) |
| Pilot Station | Second Class | Kusilvak (CA) | 1969 | 615 | 568 | +8.3% | 1.61 | 4.2 | 382.0/sq mi (147.5/km2) |
| Platinum | Second Class | Bethel (CA) | 1975 | 55 | 61 | −9.8% | 47.27 | 122.4 | 1.2/sq mi (0.46/km2) |
| Point Hope | Second Class | North Slope | 1966 | 830 | 674 | +23.1% | 5.00 | 12.9 | 166.0/sq mi (64.1/km2) |
| Port Alexander | Second Class | Prince of Wales-Hyder (CA) | 1974 | 78 | 52 | +50.0% | 3.50 | 9.1 | 22.3/sq mi (8.6/km2) |
| Port Heiden | Second Class | Lake and Peninsula | 1972 | 100 | 102 | −2.0% | 46.77 | 121.1 | 2.1/sq mi (0.81/km2) |
| Port Lions | Second Class | Kodiak Island | 1966 | 170 | 194 | −12.4% | 4.99 | 12.9 | 34.1/sq mi (13.2/km2) |
| Quinhagak | Second Class | Bethel (CA) | 1975 | 776 | 669 | +16.0% | 4.10 | 10.6 | 189.3/sq mi (73.1/km2) |
| Ruby | Second Class | Yukon-Koyukuk (CA) | 1973 | 139 | 166 | −16.3% | 7.03 | 18.2 | 19.8/sq mi (7.6/km2) |
| Russian Mission | Second Class | Kusilvak (CA) | 1970 | 421 | 312 | +34.9% | 5.37 | 13.9 | 78.4/sq mi (30.3/km2) |
| Saint Paul | Second Class | Aleutians West (CA) | 1971 | 413 | 479 | −13.8% | 42.62 | 110.4 | 9.7/sq mi (3.7/km2) |
| Sand Point |
First Class | Aleutians East | 1966 | 578 | 976 | −40.8% | 8.01 | 20.7 | 72.2/sq mi (27.9/km2) |
| Savoonga | Second Class | Nome (CA) | 1969 | 835 | 671 | +24.4% | 5.87 | 15.2 | 142.2/sq mi (54.9/km2) |
| Saxman | Second Class | Ketchikan Gateway | 1929 | 384 | 411 | −6.6% | 0.96 | 2.5 | 400.0/sq mi (154.4/km2) |
| Scammon Bay | Second Class | Kusilvak (CA) | 1967 | 600 | 474 | +26.6% | 0.47 | 1.2 | 1,276.6/sq mi (492.9/km2) |
| Selawik | Second Class | Northwest Arctic | 1977 | 809 | 829 | −2.4% | 2.33 | 6.0 | 347.2/sq mi (134.1/km2) |
| Seldovia | First Class | Kenai Peninsula | 1945 | 235 | 255 | −7.8% | 0.39 | 1.0 | 602.6/sq mi (232.7/km2) |
| Seward | Home Rule | Kenai Peninsula | 1912 | 2,717 | 2,693 | +0.9% | 13.96 | 36.2 | 194.6/sq mi (75.1/km2) |
| Shageluk | Second Class | Yukon-Koyukuk (CA) | 1970 | 100 | 83 | +20.5% | 10.22 | 26.5 | 9.8/sq mi (3.8/km2) |
| Shaktoolik | Second Class | Nome (CA) | 1969 | 212 | 251 | −15.5% | 1.07 | 2.8 | 198.1/sq mi (76.5/km2) |
| Shishmaref | Second Class | Nome (CA) | 1969 | 576 | 563 | +2.3% | 2.34 | 6.1 | 246.2/sq mi (95.1/km2) |
| Shungnak | Second Class | Northwest Arctic | 1967 | 272 | 262 | +3.8% | 8.05 | 20.8 | 33.8/sq mi (13.1/km2) |
| Sitka | Unified Home Rule | Sitka | 1971 | 8,458 | 8,881 | −4.8% | 2,870.06 | 7,433.4 | 2.9/sq mi (1.1/km2) |
| Soldotna |
Home Rule | Kenai Peninsula | 1967 | 4,342 | 4,163 | +4.3% | 6.96 | 18.0 | 623.9/sq mi (240.9/km2) |
| St. George | Second Class | Aleutians West (CA) | 1983 | 67 | 102 | −34.3% | 34.78 | 90.1 | 1.9/sq mi (0.73/km2) |
| St. Mary's | First Class | Kusilvak (CA) | 1967 | 599 | 507 | +18.1% | 44.60 | 115.5 | 13.4/sq mi (5.2/km2) |
| St. Michael | Second Class | Nome (CA) | 1969 | 456 | 401 | +13.7% | 21.75 | 56.3 | 21.0/sq mi (8.1/km2) |
| Stebbins | Second Class | Nome (CA) | 1969 | 634 | 556 | +14.0% | 32.61 | 84.5 | 19.4/sq mi (7.5/km2) |
| Tanana | First Class | Yukon-Koyukuk (CA) | 1961 | 246 | 246 | 0.0% | 10.67 | 27.6 | 23.1/sq mi (8.9/km2) |
| Teller | Second Class | Nome (CA) | 1963 | 249 | 229 | +8.7% | 1.49 | 3.9 | 167.1/sq mi (64.5/km2) |
| Tenakee Springs | Second Class | Hoonah-Angoon (CA) | 1971 | 116 | 131 | −11.5% | 13.15 | 34.1 | 8.8/sq mi (3.4/km2) |
| Thorne Bay | Second Class | Prince of Wales-Hyder (CA) | 1982 | 476 | 471 | +1.1% | 26.67 | 69.1 | 17.8/sq mi (6.9/km2) |
| Togiak | Second Class | Dillingham (CA) | 1969 | 817 | 817 | 0.0% | 42.01 | 108.8 | 19.4/sq mi (7.5/km2) |
| Toksook Bay | Second Class | Bethel (CA) | 1972 | 658 | 590 | +11.5% | 28.71 | 74.4 | 22.9/sq mi (8.8/km2) |
| Unalakleet | Second Class | Nome (CA) | 1974 | 765 | 688 | +11.2% | 2.86 | 7.4 | 267.5/sq mi (103.3/km2) |
| Unalaska | First Class | Aleutians West (CA) | 1942 | 4,254 | 4,376 | −2.8% | 102.21 | 264.7 | 41.6/sq mi (16.1/km2) |
| Upper Kalskag | Second Class | Bethel (CA) | 1975 | 212 | 210 | +1.0% | 3.56 | 9.2 | 59.6/sq mi (23.0/km2) |
| Utqiaġvik |
First Class | North Slope | 1959 | 4,927 | 4,212 | +17.0% | 18.77 | 48.6 | 262.5/sq mi (101.4/km2) |
| Valdez | Home Rule | Chugach (CA) | 1901 | 3,985 | 3,976 | +0.2% | 212.69 | 550.9 | 18.7/sq mi (7.2/km2) |
| Wainwright | Second Class | North Slope | 1962 | 628 | 556 | +12.9% | 10.31 | 26.7 | 60.9/sq mi (23.5/km2) |
| Wales | Second Class | Nome (CA) | 1964 | 168 | 145 | +15.9% | 2.30 | 6.0 | 73.0/sq mi (28.2/km2) |
| Wasilla | First Class | Matanuska-Susitna | 1974 | 9,054 | 7,831 | +15.6% | 12.40 | 32.1 | 730.2/sq mi (281.9/km2) |
| Whale Pass | Second Class | Prince of Wales-Hyder (CA) | 2017 | 86 | — | — | 19.86 | 51.4 | 4.3/sq mi (1.7/km2) |
| White Mountain | Second Class | Nome (CA) | 1969 | 185 | 190 | −2.6% | 1.82 | 4.7 | 101.6/sq mi (39.2/km2) |
| Whittier | Second Class | Chugach (CA) | 1969 | 272 | 220 | +23.6% | 12.25 | 31.7 | 22.2/sq mi (8.6/km2) |
| Wrangell | Unified Home Rule | Wrangell | 2008 | 2,127 | 2,369 | −10.2% | 2,555.99 | 6,620.0 | 0.8/sq mi (0.31/km2) |
| Total cities | – | – | – | 497,374 | 457,229 | +8.8% | 12,182.77 | 31,553.2 | 40.8/sq mi (15.8/km2) |
| Alaska | – | – | – | 733,391 | 710,231 | +3.3% | 570,640.95 | 1,477,953.3 | 1.3/sq mi (0.50/km2) |
See also
 In Spanish: Anexo:Localidades de Alaska para niños
