
List of municipalities in Maryland facts for kids

Maryland is a state in the Southern United States. In 2020, about 6.1 million people lived there. It's the 18th most populated state. Maryland is also one of the smallest states by land area. It covers about 9,707 square miles (25,142 square kilometers).
The state has 23 counties. It also has 157 municipalities. These are places like cities, towns, or villages. Even though municipalities cover only a small part of Maryland's land, they are home to many people. About 1.5 million people live in these cities, towns, and villages. Outside of these areas, the local government is at the county level.
Most municipalities in Maryland get their power from the state. They are chartered as cities, towns, or villages. But there's no real difference in how much power a "city" has compared to a "town" or "village." They all have the same rights under state law. Baltimore is special. It's an independent city. This means it acts more like a county than a city. It has its own broad law-making powers.
The biggest municipality in Maryland by population is Baltimore. It has about 585,708 residents. Baltimore is also the largest by land area, covering about 80.94 square miles (209.6 square kilometers). The smallest municipality is Port Tobacco Village. It has only 18 residents! The smallest by land area is Brookview, which is tiny at 0.04 square miles (0.10 square kilometers).
Many large communities in Maryland are not officially cities or towns. They are called "census-designated places." Some examples include Columbia, Germantown, Silver Spring, and Ellicott City.
Maryland's Biggest Municipalities
- Largest municipalities in Maryland by population
-
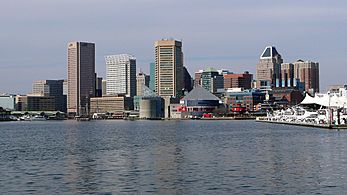
Skyline of Baltimore, the largest municipality in Maryland by population.
-
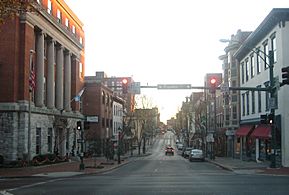
Frederick, the second-largest municipality in Maryland by population.
-
Gaithersburg, a suburb of Washington, D.C., and third-largest municipality by population.
-
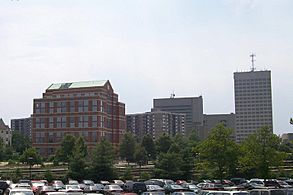
Rockville, a suburb of Washington, D.C., and fourth-largest municipality by population.
-
Bowie, the fifth-largest municipality in Maryland by population.
-
Hagerstown, Maryland's sixth-largest municipality by population.
-
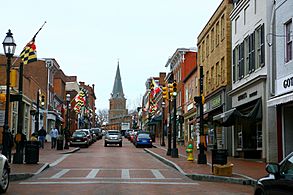
Annapolis, the state's capital and seventh-largest city by population.


State capital and county seat County seat
List of Municipalities in Maryland
This table shows a list of municipalities in Maryland. It includes their population and land area. Some cities are also county seats, which means they are the main government center for their county. Annapolis is special because it's both the state capital and a county seat.
| Name | Type | County(ies) | Population (2020) |
Population (2010) |
Change | Land area (2010) |
Population density | |
|---|---|---|---|---|---|---|---|---|
| sq mi | km2 | |||||||
| Aberdeen | City | Harford | 16,254 | 14,959 | +8.7% | 6.80 | 17.6 | 2,390.3/sq mi (922.9/km2) |
| Accident | Town | Garrett | 338 | 325 | +4.0% | 0.49 | 1.3 | 689.8/sq mi (266.3/km2) |
| Annapolis |
City | Anne Arundel | 40,812 | 38,394 | +6.3% | 7.18 | 18.6 | 5,684.1/sq mi (2,194.6/km2) |
| Baltimore | City | — | 585,708 | 620,961 | −5.7% | 80.94 | 209.6 | 7,236.3/sq mi (2,794.0/km2) |
| Barclay | Town | Queen Anne's | 183 | 120 | +52.5% | 0.16 | 0.41 | 1,143.8/sq mi (441.6/km2) |
| Barnesville | Town | Montgomery | 144 | 172 | −16.3% | 0.49 | 1.3 | 293.9/sq mi (113.5/km2) |
| Barton | Town | Allegany | 464 | 457 | +1.5% | 0.22 | 0.57 | 2,109.1/sq mi (814.3/km2) |
| Bel Air |
Town | Harford | 10,661 | 10,120 | +5.3% | 2.93 | 7.6 | 3,638.6/sq mi (1,404.9/km2) |
| Berlin | Town | Worcester | 5,026 | 4,485 | +12.1% | 3.15 | 8.2 | 1,595.6/sq mi (616.1/km2) |
| Berwyn Heights | Town | Prince George's | 3,345 | 3,123 | +7.1% | 0.69 | 1.8 | 4,847.8/sq mi (1,871.7/km2) |
| Betterton | Town | Kent | 286 | 345 | −17.1% | 0.99 | 2.6 | 288.9/sq mi (111.5/km2) |
| Bladensburg | Town | Prince George's | 9,657 | 9,148 | +5.6% | 1.00 | 2.6 | 9,657.0/sq mi (3,728.6/km2) |
| Boonsboro | Town | Washington | 3,799 | 3,336 | +13.9% | 2.90 | 7.5 | 1,310.0/sq mi (505.8/km2) |
| Bowie | City | Prince George's | 58,329 | 54,727 | +6.6% | 18.43 | 47.7 | 3,164.9/sq mi (1,222.0/km2) |
| Brentwood | Town | Prince George's | 3,828 | 3,046 | +25.7% | 0.38 | 0.98 | 10,073.7/sq mi (3,889.5/km2) |
| Brookeville | Town | Montgomery | 166 | 134 | +23.9% | 0.12 | 0.31 | 1,383.3/sq mi (534.1/km2) |
| Brookview | Town | Dorchester | 48 | 60 | −20.0% | 0.04 | 0.10 | 1,200.0/sq mi (463.3/km2) |
| Brunswick | City | Frederick | 7,762 | 5,870 | +32.2% | 3.26 | 8.4 | 2,381.0/sq mi (919.3/km2) |
| Burkittsville | Town | Frederick | 142 | 151 | −6.0% | 0.45 | 1.2 | 315.6/sq mi (121.9/km2) |
| Cambridge |
City | Dorchester | 13,096 | 12,326 | +6.2% | 10.34 | 26.8 | 1,266.5/sq mi (489.0/km2) |
| Capitol Heights | Town | Prince George's | 4,050 | 4,337 | −6.6% | 0.80 | 2.1 | 5,062.5/sq mi (1,954.6/km2) |
| Cecilton | Town | Cecil | 676 | 663 | +2.0% | 0.46 | 1.2 | 1,469.6/sq mi (567.4/km2) |
| Centreville |
Town | Queen Anne's | 4,727 | 4,285 | +10.3% | 2.45 | 6.3 | 1,929.4/sq mi (744.9/km2) |
| Charlestown | Town | Cecil | 1,496 | 1,183 | +26.5% | 1.19 | 3.1 | 1,257.1/sq mi (485.4/km2) |
| Chesapeake Beach | Town | Calvert | 6,356 | 5,753 | +10.5% | 2.71 | 7.0 | 2,345.4/sq mi (905.6/km2) |
| Chesapeake City | Town | Cecil | 736 | 673 | +9.4% | 0.50 | 1.3 | 1,472.0/sq mi (568.3/km2) |
| Chestertown |
Town | Kent | 5,532 | 5,252 | +5.3% | 2.60 | 6.7 | 2,127.7/sq mi (821.5/km2) |
| Cheverly | Town | Prince George's | 6,170 | 6,173 | 0.0% | 1.35 | 3.5 | 4,570.4/sq mi (1,764.6/km2) |
| Chevy Chase | Town | Montgomery | 2,904 | 2,824 | +2.8% | 0.47 | 1.2 | 6,178.7/sq mi (2,385.6/km2) |
| Chevy Chase Section Five | Village | Montgomery | 672 | 658 | +2.1% | 0.10 | 0.26 | 6,720.0/sq mi (2,594.6/km2) |
| Chevy Chase Section Three | Village | Montgomery | 802 | 760 | +5.5% | 0.12 | 0.31 | 6,683.3/sq mi (2,580.4/km2) |
| Chevy Chase View | Town | Montgomery | 1,005 | 920 | +9.2% | 0.28 | 0.73 | 3,589.3/sq mi (1,385.8/km2) |
| Chevy Chase Village | Town | Montgomery | 2,049 | 1,953 | +4.9% | 0.42 | 1.1 | 4,878.6/sq mi (1,883.6/km2) |
| Church Creek | Town | Dorchester | 102 | 125 | −18.4% | 0.34 | 0.88 | 300.0/sq mi (115.8/km2) |
| Church Hill | Town | Queen Anne's | 808 | 745 | +8.5% | 0.71 | 1.8 | 1,138.0/sq mi (439.4/km2) |
| Clear Spring | Town | Washington | 372 | 358 | +3.9% | 0.11 | 0.28 | 3,381.8/sq mi (1,305.7/km2) |
| College Park | City | Prince George's | 34,740 | 30,413 | +14.2% | 5.64 | 14.6 | 6,159.6/sq mi (2,378.2/km2) |
| Colmar Manor | Town | Prince George's | 1,588 | 1,404 | +13.1% | 0.47 | 1.2 | 3,378.7/sq mi (1,304.5/km2) |
| Cottage City | Town | Prince George's | 1,335 | 1,305 | +2.3% | 0.25 | 0.65 | 5,340.0/sq mi (2,061.8/km2) |
| Crisfield | City | Somerset | 2,475 | 2,726 | −9.2% | 1.62 | 4.2 | 1,527.8/sq mi (589.9/km2) |
| Cumberland |
City | Allegany | 19,076 | 20,859 | −8.5% | 10.08 | 26.1 | 1,892.5/sq mi (730.7/km2) |
| Deer Park | Town | Garrett | 303 | 399 | −24.1% | 1.00 | 2.6 | 303.0/sq mi (117.0/km2) |
| Delmar | Town | Wicomico | 3,798 | 3,003 | +26.5% | 1.72 | 4.5 | 2,208.1/sq mi (852.6/km2) |
| Denton |
Town | Caroline | 4,848 | 4,418 | +9.7% | 5.28 | 13.7 | 918.2/sq mi (354.5/km2) |
| District Heights | City | Prince George's | 5,959 | 5,837 | +2.1% | 0.93 | 2.4 | 6,407.5/sq mi (2,473.9/km2) |
| Eagle Harbor | Town | Prince George's | 67 | 63 | +6.3% | 0.12 | 0.31 | 558.3/sq mi (215.6/km2) |
| East New Market | Town | Dorchester | 389 | 400 | −2.7% | 0.40 | 1.0 | 972.5/sq mi (375.5/km2) |
| Easton |
Town | Talbot | 17,101 | 15,945 | +7.2% | 10.56 | 27.4 | 1,619.4/sq mi (625.3/km2) |
| Edmonston | Town | Prince George's | 1,617 | 1,445 | +11.9% | 0.39 | 1.0 | 4,146.2/sq mi (1,600.9/km2) |
| Eldorado | Town | Dorchester | 45 | 59 | −23.7% | 0.08 | 0.21 | 562.5/sq mi (217.2/km2) |
| Elkton |
Town | Cecil | 15,807 | 15,443 | +2.4% | 8.35 | 21.6 | 1,893.1/sq mi (730.9/km2) |
| Emmitsburg | Town | Frederick | 2,770 | 2,814 | −1.6% | 1.52 | 3.9 | 1,822.4/sq mi (703.6/km2) |
| Fairmount Heights | Town | Prince George's | 1,528 | 1,494 | +2.3% | 0.27 | 0.70 | 5,659.3/sq mi (2,185.1/km2) |
| Federalsburg | Town | Caroline | 2,833 | 2,739 | +3.4% | 1.93 | 5.0 | 1,467.9/sq mi (566.8/km2) |
| Forest Heights | Town | Prince George's | 2,658 | 2,447 | +8.6% | 0.48 | 1.2 | 5,537.5/sq mi (2,138.0/km2) |
| Frederick |
City | Frederick | 78,171 | 65,239 | +19.8% | 21.99 | 57.0 | 3,554.8/sq mi (1,372.5/km2) |
| Friendsville | Town | Garrett | 438 | 491 | −10.8% | 0.91 | 2.4 | 481.3/sq mi (185.8/km2) |
| Frostburg | City | Allegany | 7,027 | 9,002 | −21.9% | 3.42 | 8.9 | 2,054.7/sq mi (793.3/km2) |
| Fruitland | City | Wicomico | 5,534 | 4,866 | +13.7% | 3.78 | 9.8 | 1,464.0/sq mi (565.3/km2) |
| Funkstown | Town | Washington | 852 | 904 | −5.8% | 0.36 | 0.93 | 2,366.7/sq mi (913.8/km2) |
| Gaithersburg | City | Montgomery | 69,657 | 59,933 | +16.2% | 10.20 | 26.4 | 6,829.1/sq mi (2,636.7/km2) |
| Galena | Town | Kent | 539 | 612 | −11.9% | 0.36 | 0.93 | 1,497.2/sq mi (578.1/km2) |
| Galestown | Town | Dorchester | 111 | 138 | −19.6% | 0.23 | 0.60 | 482.6/sq mi (186.3/km2) |
| Garrett Park | Town | Montgomery | 996 | 992 | +0.4% | 0.26 | 0.67 | 3,830.8/sq mi (1,479.1/km2) |
| Glenarden | City | Prince George's | 6,402 | 6,000 | +6.7% | 1.22 | 3.2 | 5,247.5/sq mi (2,026.1/km2) |
| Glen Echo | Town | Montgomery | 279 | 255 | +9.4% | 0.10 | 0.26 | 2,790.0/sq mi (1,077.2/km2) |
| Goldsboro | Town | Caroline | 211 | 246 | −14.2% | 0.74 | 1.9 | 285.1/sq mi (110.1/km2) |
| Grantsville | Town | Garrett | 968 | 766 | +26.4% | 0.98 | 2.5 | 987.8/sq mi (381.4/km2) |
| Greenbelt | City | Prince George's | 24,921 | 23,068 | +8.0% | 6.28 | 16.3 | 3,968.3/sq mi (1,532.2/km2) |
| Greensboro | Town | Caroline | 1,919 | 1,931 | −0.6% | 1.05 | 2.7 | 1,827.6/sq mi (705.6/km2) |
| Hagerstown |
City | Washington | 43,527 | 39,662 | +9.7% | 11.79 | 30.5 | 3,691.9/sq mi (1,425.5/km2) |
| Hampstead | Town | Carroll | 6,241 | 6,323 | −1.3% | 3.19 | 8.3 | 1,956.4/sq mi (755.4/km2) |
| Hancock | Town | Washington | 1,557 | 1,545 | +0.8% | 2.73 | 7.1 | 570.3/sq mi (220.2/km2) |
| Havre de Grace | City | Harford | 14,807 | 12,952 | +14.3% | 5.50 | 14.2 | 2,692.2/sq mi (1,039.5/km2) |
| Hebron | Town | Wicomico | 1,113 | 1,084 | +2.7% | 1.28 | 3.3 | 869.5/sq mi (335.7/km2) |
| Henderson | Town | Caroline | 160 | 146 | +9.6% | 0.13 | 0.34 | 1,230.8/sq mi (475.2/km2) |
| Highland Beach | Town | Anne Arundel | 118 | 96 | +22.9% | 0.06 | 0.16 | 1,966.7/sq mi (759.3/km2) |
| Hillsboro | Town | Caroline | 128 | 161 | −20.5% | 0.15 | 0.39 | 853.3/sq mi (329.5/km2) |
| Hurlock | Town | Dorchester | 2,070 | 2,092 | −1.1% | 2.66 | 6.9 | 778.2/sq mi (300.5/km2) |
| Hyattsville | City | Prince George's | 21,187 | 17,557 | +20.7% | 2.67 | 6.9 | 7,935.2/sq mi (3,063.8/km2) |
| Indian Head | Town | Charles | 3,894 | 3,844 | +1.3% | 1.23 | 3.2 | 3,165.9/sq mi (1,222.4/km2) |
| Keedysville | Town | Washington | 1,213 | 1,152 | +5.3% | 0.92 | 2.4 | 1,318.5/sq mi (509.1/km2) |
| Kensington | Town | Montgomery | 2,122 | 2,213 | −4.1% | 0.48 | 1.2 | 4,420.8/sq mi (1,706.9/km2) |
| Kitzmiller | Town | Garrett | 300 | 321 | −6.5% | 0.22 | 0.57 | 1,363.6/sq mi (526.5/km2) |
| Landover Hills | Town | Prince George's | 1,815 | 1,687 | +7.6% | 0.30 | 0.78 | 6,050.0/sq mi (2,335.9/km2) |
| La Plata |
Town | Charles | 10,159 | 8,753 | +16.1% | 7.40 | 19.2 | 1,372.8/sq mi (530.0/km2) |
| Laurel | City | Prince George's | 30,060 | 25,115 | +19.7% | 4.30 | 11.1 | 6,990.7/sq mi (2,699.1/km2) |
| Laytonsville | Town | Montgomery | 572 | 353 | +62.0% | 1.04 | 2.7 | 550.0/sq mi (212.4/km2) |
| Leonardtown |
Town | St. Mary's | 4,563 | 2,930 | +55.7% | 3.18 | 8.2 | 1,434.9/sq mi (554.0/km2) |
| Loch Lynn Heights | Town | Garrett | 493 | 552 | −10.7% | 0.32 | 0.83 | 1,540.6/sq mi (594.8/km2) |
| Lonaconing | Town | Allegany | 1,001 | 1,214 | −17.5% | 0.41 | 1.1 | 2,441.5/sq mi (942.7/km2) |
| Luke | Town | Allegany | 85 | 65 | +30.8% | 0.27 | 0.70 | 314.8/sq mi (121.5/km2) |
| Manchester | Town | Carroll | 5,408 | 4,808 | +12.5% | 2.34 | 6.1 | 2,311.1/sq mi (892.3/km2) |
| Mardela Springs | Town | Wicomico | 357 | 347 | +2.9% | 0.39 | 1.0 | 915.4/sq mi (353.4/km2) |
| Martin's Additions | Village | Montgomery | 946 | 933 | +1.4% | 0.14 | 0.36 | 6,757.1/sq mi (2,608.9/km2) |
| Marydel | Town | Caroline | 176 | 141 | +24.8% | 0.08 | 0.21 | 2,200.0/sq mi (849.4/km2) |
| Middletown | Town | Frederick | 4,943 | 4,136 | +19.5% | 1.74 | 4.5 | 2,840.8/sq mi (1,096.8/km2) |
| Midland | Town | Allegany | 488 | 446 | +9.4% | 0.19 | 0.49 | 2,568.4/sq mi (991.7/km2) |
| Millington | Town | Kent, Queen Anne's | 549 | 642 | −14.5% | 0.66 | 1.7 | 831.8/sq mi (321.2/km2) |
| Morningside | Town | Prince George's | 1,240 | 2,015 | −38.5% | 0.56 | 1.5 | 2,214.3/sq mi (854.9/km2) |
| Mountain Lake Park | Town | Garrett | 2,147 | 2,092 | +2.6% | 1.94 | 5.0 | 1,106.7/sq mi (427.3/km2) |
| Mount Airy | Town | Carroll, Frederick | 9,654 | 9,288 | +3.9% | 4.12 | 10.7 | 2,343.2/sq mi (904.7/km2) |
| Mount Rainier | City | Prince George's | 8,333 | 8,080 | +3.1% | 0.65 | 1.7 | 12,820.0/sq mi (4,949.8/km2) |
| Myersville | Town | Frederick | 1,748 | 1,626 | +7.5% | 1.02 | 2.6 | 1,713.7/sq mi (661.7/km2) |
| New Carrollton | City | Prince George's | 13,715 | 12,135 | +13.0% | 1.53 | 4.0 | 8,964.1/sq mi (3,461.1/km2) |
| New Market | Town | Frederick | 1,525 | 656 | +132.5% | 0.80 | 2.1 | 1,906.3/sq mi (736.0/km2) |
| New Windsor | Town | Carroll | 1,441 | 1,396 | +3.2% | 0.74 | 1.9 | 1,947.3/sq mi (751.9/km2) |
| North Beach | Town | Calvert | 2,146 | 1,978 | +8.5% | 0.33 | 0.85 | 6,503.0/sq mi (2,510.8/km2) |
| North Brentwood | Town | Prince George's | 593 | 517 | +14.7% | 0.10 | 0.26 | 5,930.0/sq mi (2,289.6/km2) |
| North Chevy Chase | Village | Montgomery | 682 | 519 | +31.4% | 0.11 | 0.28 | 6,200.0/sq mi (2,393.8/km2) |
| North East | Town | Cecil | 4,085 | 3,572 | +14.4% | 2.06 | 5.3 | 1,983.0/sq mi (765.6/km2) |
| Oakland |
Town | Garrett | 1,851 | 1,925 | −3.8% | 2.59 | 6.7 | 714.7/sq mi (275.9/km2) |
| Ocean City | Town | Worcester | 6,844 | 7,102 | −3.6% | 4.41 | 11.4 | 1,551.9/sq mi (599.2/km2) |
| Oxford | Town | Talbot | 611 | 651 | −6.1% | 0.54 | 1.4 | 1,131.5/sq mi (436.9/km2) |
| Perryville | Town | Cecil | 4,391 | 4,361 | +0.7% | 3.05 | 7.9 | 1,439.7/sq mi (555.9/km2) |
| Pittsville | Town | Wicomico | 1,636 | 1,417 | +15.5% | 1.68 | 4.4 | 973.8/sq mi (376.0/km2) |
| Pocomoke City | City | Worcester | 4,295 | 4,184 | +2.7% | 3.69 | 9.6 | 1,164.0/sq mi (449.4/km2) |
| Poolesville | Town | Montgomery | 5,742 | 4,883 | +17.6% | 3.93 | 10.2 | 1,461.1/sq mi (564.1/km2) |
| Port Deposit | Town | Cecil | 614 | 653 | −6.0% | 2.27 | 5.9 | 270.5/sq mi (104.4/km2) |
| Port Tobacco Village | Town | Charles | 18 | 13 | +38.5% | 0.16 | 0.41 | 112.5/sq mi (43.4/km2) |
| Preston | Town | Caroline | 673 | 719 | −6.4% | 0.57 | 1.5 | 1,180.7/sq mi (455.9/km2) |
| Princess Anne |
Town | Somerset | 3,446 | 3,290 | +4.7% | 1.67 | 4.3 | 2,063.5/sq mi (796.7/km2) |
| Queen Anne | Town | Queen Anne's, Talbot | 192 | 222 | −13.5% | 0.13 | 0.34 | 1,476.9/sq mi (570.2/km2) |
| Queenstown | Town | Queen Anne's | 705 | 664 | +6.2% | 1.45 | 3.8 | 486.2/sq mi (187.7/km2) |
| Ridgely | Town | Caroline | 1,611 | 1,639 | −1.7% | 1.78 | 4.6 | 905.1/sq mi (349.5/km2) |
| Rising Sun | Town | Cecil | 2,740 | 2,781 | −1.5% | 1.26 | 3.3 | 2,174.6/sq mi (839.6/km2) |
| Riverdale Park | Town | Prince George's | 7,351 | 6,956 | +5.7% | 1.65 | 4.3 | 4,455.2/sq mi (1,720.2/km2) |
| Rock Hall | Town | Kent | 1,198 | 1,310 | −8.5% | 1.34 | 3.5 | 894.0/sq mi (345.2/km2) |
| Rockville |
City | Montgomery | 67,117 | 61,209 | +9.7% | 13.51 | 35.0 | 4,967.9/sq mi (1,918.1/km2) |
| Rosemont | Village | Frederick | 272 | 294 | −7.5% | 0.56 | 1.5 | 485.7/sq mi (187.5/km2) |
| St. Michaels | Town | Talbot | 1,049 | 1,029 | +1.9% | 1.15 | 3.0 | 912.2/sq mi (352.2/km2) |
| Salisbury |
City | Wicomico | 33,050 | 30,343 | +8.9% | 13.40 | 34.7 | 2,466.4/sq mi (952.3/km2) |
| Seat Pleasant | City | Prince George's | 4,522 | 4,542 | −0.4% | 0.73 | 1.9 | 6,194.5/sq mi (2,391.7/km2) |
| Secretary | Town | Dorchester | 472 | 535 | −11.8% | 0.26 | 0.67 | 1,815.4/sq mi (700.9/km2) |
| Sharpsburg | Town | Washington | 560 | 705 | −20.6% | 0.23 | 0.60 | 2,434.8/sq mi (940.1/km2) |
| Sharptown | Town | Wicomico | 691 | 651 | +6.1% | 0.41 | 1.1 | 1,685.4/sq mi (650.7/km2) |
| Smithsburg | Town | Washington | 2,977 | 2,975 | +0.1% | 1.05 | 2.7 | 2,835.2/sq mi (1,094.7/km2) |
| Snow Hill |
Town | Worcester | 2,156 | 2,103 | +2.5% | 3.01 | 7.8 | 716.3/sq mi (276.6/km2) |
| Somerset | Town | Montgomery | 1,187 | 1,216 | −2.4% | 0.27 | 0.70 | 4,396.3/sq mi (1,697.4/km2) |
| Sudlersville | Town | Queen Anne's | 507 | 497 | +2.0% | 0.94 | 2.4 | 539.4/sq mi (208.3/km2) |
| Sykesville | Town | Carroll | 4,316 | 4,436 | −2.7% | 1.58 | 4.1 | 2,731.6/sq mi (1,054.7/km2) |
| Takoma Park | City | Montgomery | 17,629 | 16,715 | +5.5% | 2.08 | 5.4 | 8,475.5/sq mi (3,272.4/km2) |
| Taneytown | City | Carroll | 7,234 | 6,728 | +7.5% | 3.03 | 7.8 | 2,387.5/sq mi (921.8/km2) |
| Templeville | Town | Caroline, Queen Anne's | 113 | 138 | −18.1% | 0.08 | 0.21 | 1,412.5/sq mi (545.4/km2) |
| Thurmont | Town | Frederick | 6,213 | 6,170 | +0.7% | 3.12 | 8.1 | 1,991.3/sq mi (768.8/km2) |
| Trappe | Town | Talbot | 1,177 | 1,077 | +9.3% | 2.78 | 7.2 | 423.4/sq mi (163.5/km2) |
| Union Bridge | Town | Carroll | 936 | 975 | −4.0% | 1.04 | 2.7 | 900.0/sq mi (347.5/km2) |
| University Park | Town | Prince George's | 2,454 | 2,548 | −3.7% | 0.50 | 1.3 | 4,908.0/sq mi (1,895.0/km2) |
| Upper Marlboro |
Town | Prince George's | 652 | 631 | +3.3% | 0.40 | 1.0 | 1,630.0/sq mi (629.3/km2) |
| Vienna | Town | Dorchester | 270 | 271 | −0.4% | 0.19 | 0.49 | 1,421.1/sq mi (548.7/km2) |
| Walkersville | Town | Frederick | 6,156 | 5,800 | +6.1% | 4.35 | 11.3 | 1,415.2/sq mi (546.4/km2) |
| Washington Grove | Town | Montgomery | 505 | 555 | −9.0% | 0.35 | 0.91 | 1,442.9/sq mi (557.1/km2) |
| Westernport | Town | Allegany | 1,812 | 1,888 | −4.0% | 0.87 | 2.3 | 2,082.8/sq mi (804.2/km2) |
| Westminster |
City | Carroll | 20,126 | 18,590 | +8.3% | 6.63 | 17.2 | 3,035.6/sq mi (1,172.1/km2) |
| Willards | Town | Wicomico | 963 | 958 | +0.5% | 1.07 | 2.8 | 900.0/sq mi (347.5/km2) |
| Williamsport | Town | Washington | 2,083 | 2,137 | −2.5% | 1.04 | 2.7 | 2,002.9/sq mi (773.3/km2) |
| Woodsboro | Town | Frederick | 1,092 | 1,141 | −4.3% | 0.71 | 1.8 | 1,538.0/sq mi (593.8/km2) |
| Total | — | — | 1,555,037 | 1,511,348 | +2.9% | 425.78 | 1,102.8 | 3,652.2/sq mi (1,410.1/km2) |
See also
 In Spanish: Anexo:Localidades de Maryland para niños
- List of census-designated places in Maryland
- List of counties in Maryland
- Maryland Municipal League
