
Climate of Australia facts for kids

Australia's climate is mostly shaped by its huge size and by hot, sinking air from the subtropical high-pressure belt. This belt moves across the country with the seasons. Australia's weather can change a lot, with many droughts that last for a long time. These droughts are partly caused by something called the El Niño-Southern Oscillation.
Because Australia is so big, it has many different climates. Most of Australia is desert or semi-dry. Only the south-east and south-west parts have a temperate climate (mild weather) and good soil. The northern part of the country has a tropical climate, which means it's hot and humid. This area includes grasslands and deserts. Australia holds many heat records, like having the hottest region all year round and the highest amount of sunshine.
Australia is a medium-sized continent. It's far from the very cold polar regions because of the Southern Ocean. This means Australia doesn't get swept by freezing polar air in winter, like continents in the northern half of the world do. So, Australia's winters are usually mild. The temperature difference between summer and winter is not as big as in northern continents. However, in Australia's mountain areas, the change between seasons is more noticeable. Temperatures have ranged from over 50 °C (122 °F) to as low as -23.0 °C (-9.4 °F).
The El Niño–Southern Oscillation affects weather around the world. Australia is one of the most affected continents. It experiences long droughts but also very wet periods. Sometimes, a dust storm can cover a whole region. There are even occasional tornadoes. Tropical cyclones, heat waves, bushfires, and frosts in Australia are also linked to the Southern Oscillation. Rising levels of salinity (saltiness) and desertification (land turning into desert) are also changing the landscape.
Climate change in Australia is a big topic in Australia. Temperatures in the country went up by about 0.7 °C (1.3 °F) between 1910 and 2004. This follows a worldwide trend of global warming. Nighttime temperatures have risen faster than daytime temperatures recently. This warming in the late 1900s is mostly due to the increased greenhouse effect. The Bureau of Meteorology (BOM) says that 80% of Australia's land gets less than 600 mm (24 in) of rain each year. Half of the country gets even less than 300 mm (12 in). Overall, Australia gets a very low average of 419 mm (16.5 in) of rain each year.
Contents
Climate in Australian States and Territories
Australian Capital Territory


The Australian Capital Territory (ACT) has cool to cold winters. This is because it's high up (over 650 m or 2,130 ft), located further south, and completely surrounded by land. Canberra has warm to hot, dry summers with some thunderstorms. Heavy frosts are common, and radiation fog often appears. Many of the higher mountains to the west get snow for much of winter and early spring. Thunderstorms can happen from October to March. The ACT gets about 623 mm (24.5 in) of rain each year. Rainfall is highest in spring and summer and lowest in winter. The region is dry because it's on the leeward (sheltered) side of the Brindabella Ranges.
The highest temperature ever recorded in the ACT was 44.0 °C (111.2 °F) at Canberra Airport on January 4, 2020. The lowest temperature was -14.6 °C (5.7 °F) at Gudgenby on July 11, 1971.
New South Wales


More than half of New South Wales (NSW) has a desert or semi-dry climate. The eastern part has a temperate climate. This ranges from humid subtropical in the north and around Sydney, to oceanic on the south coast. The Snowy Mountains in the south-east have an alpine climate or subpolar oceanic climate. This means cool to cold weather all year, with heavy snow in winter and spring. Further inland, the climate is semi-dry and becomes a desert climate in the western part of the state.
Weather in the southern half of NSW is generally warm to hot in summer and cool in winter. Seasons are clearer in the southern half, especially in the South West Slopes, Central West, and Riverina regions. Along the coast and east of the Great Dividing Range, most rain falls in summer. In the ranges and further inland, rain usually peaks in spring. However, the South West Slopes have more rain in winter. The New England and North West Slopes get most of their rain in summer. On hot summer days, a southerly buster (a strong cool wind) can sometimes cool down coastal NSW.
The warmest region is the north-west, where summers are extremely hot. Winters there are relatively cooler and dry. The weather in the north-east region, or North Coast, is moderately hot, humid, and rainy in summer. Winters are mild with more sunshine and little temperature change. The Northern Tablelands have milder summers and colder winters. This is because they are high up and inland on the Great Dividing Range. The south-east coastal plain gets foehn winds, especially in winter and spring. These winds can increase fire danger.
The coldest region is the Snowy Mountains, where snow and ice last for a long time in winter. The Blue Mountains, Southern Tablelands, and Central Tablelands are on the Great Dividing Range. They have mild to warm summers and cold winters, but not as severe as the Snowy Mountains. Places in the valleys of the range, like Bathurst and Goulburn, have recorded freezing or near-freezing lows even in summer.
The highest temperature recorded in NSW was 49.7 °C (121.5 °F) at Menindee on January 10, 1939. The lowest temperature was -23.0 °C (-9.4 °F) at Charlotte Pass on June 29, 1994. This is the lowest temperature ever recorded in Australia (not including the Australian Antarctic Territory).
Rainfall varies across the state. The far north-west gets the least, less than 180 mm (7.1 in) annually. The east gets between 600 mm (24 in) and 1,200 mm (47 in) of rain.

| Place | Climate type | January mean max. temp | January mean min. temp | July mean max. temp | July mean min. temp | No. clear days | Annual precipitation |
|---|---|---|---|---|---|---|---|
| Albury | Cfa | 31 °C (88 °F) | 17 °C (63 °F) | 12 °C (54 °F) | 4 °C (39 °F) | 108 | 699 mm (27.5 in) |
| Armidale | Cfb | 26 °C (79 °F) | 14 °C (57 °F) | 12 °C (54 °F) | 1 °C (34 °F) | 106 | 743 mm (29.3 in) |
| Broken Hill | BWh | 33 °C (91 °F) | 19 °C (66 °F) | 15 °C (59 °F) | 5 °C (41 °F) | 137 | 245 mm (9.6 in) |
| Charlotte Pass | Cfc/Dfc | 18 °C (64 °F) | 5 °C (41 °F) | 2 °C (36 °F) | -7 °C (19 °F) | 78 | 1,948 mm (76.7 in) |
| Coffs Harbour | Cfa | 27 °C (81 °F) | 20 °C (68 °F) | 19 °C (66 °F) | 8 °C (46 °F) | 122 | 1,668 mm (65.7 in) |
| Orange | Cfb | 27 °C (81 °F) | 13 °C (55 °F) | 10 °C (50 °F) | 2 °C (36 °F) | 100 | 927 mm (36.5 in) |
| Penrith | Cfa | 31 °C (88 °F) | 18 °C (64 °F) | 18 °C (64 °F) | 5 °C (41 °F) | 103 | 696 mm (27.4 in) |
| Sydney (capital) | Cfa | 27 °C (81 °F) | 20 °C (68 °F) | 17 °C (63 °F) | 9 °C (48 °F) | 104 | 1,150 mm (45 in) |
| Wagga Wagga | Cfa | 32 °C (90 °F) | 16 °C (61 °F) | 13 °C (55 °F) | 3 °C (37 °F) | 124 | 566 mm (22.3 in) |
| Wollongong | Cfb | 26 °C (79 °F) | 18 °C (64 °F) | 17 °C (63 °F) | 8 °C (46 °F) | 107 | 1,346 mm (53.0 in) |
Northern Territory

| Average monthly maximum temperature in Northern Territory |
||||
| Month | Darwin | Alice Springs | ||
|---|---|---|---|---|
| January | 31.8 °C (89.2 °F) | 36.4 °C (97.5 °F) | ||
| February | 31.4 °C (88.5 °F) | 35.1 °C (95.2 °F) | ||
| March | 31.9 °C (89.4 °F) | 32.7 °C (90.9 °F) | ||
| April | 32.7 °C (90.9 °F) | 28.2 °C (82.8 °F) | ||
| May | 32.0 °C (89.6 °F) | 23.0 °C (73.4 °F) | ||
| June | 30.6 °C (87.1 °F) | 19.8 °C (67.6 °F) | ||
| July | 30.5 °C (86.9 °F) | 19.7 °C (67.5 °F) | ||
| August | 31.3 °C (88.3 °F) | 22.5 °C (72.5 °F) | ||
| September | 32.5 °C (90.5 °F) | 27.2 °C (81.0 °F) | ||
| October | 33.2 °C (91.8 °F) | 31.0 °C (87.8 °F) | ||
| November | 33.3 °C (91.9 °F) | 33.6 °C (92.5 °F) | ||
| December | 32.6 °C (90.7 °F) | 35.4 °C (95.7 °F) | ||
| Source: Bureau of Meteorology | ||||
The Northern Territory (NT) has two main climate zones. The northern part, including Darwin, has a tropical savannah climate. This means it's very humid and has two seasons: the wet season (October to April) and the dry season (May to September). During the dry season, almost every day is warm and sunny. Humidity is low in the afternoons. Very little rain falls between May and September. In the coolest months of June and July, the lowest daily temperature might drop to 14 °C (57 °F), but rarely lower. Frost has never been recorded there.
The wet season brings tropical cyclones and monsoon rains. Most rain falls between December and March (summer in the Southern Hemisphere). Thunderstorms are common then, and afternoon humidity is often over 70%. On average, more than 1,570 mm (62 in) of rain falls in the north. Thunderstorms can create amazing lightning shows.

The rest of the NT is in the desert center of Australia. This includes Alice Springs and Uluru. It's a dry or semi-dry area with little rain, usually falling in the hottest months from October to March. Its seasons are clearer than in the north. Summers are very hot, often over 35 °C (95 °F). Winters are relatively cool, with lowest average temperatures dropping to 5 °C (41 °F), and a few frosty nights. Central Australia gets less than 250 mm (9.8 in) of rain each year.
The highest temperature recorded in the NT was 48.3 °C (118.9 °F) at Finke on January 1 and 2, 1960. The lowest temperature was -7.5 °C (18.5 °F) at Alice Springs on July 12, 1976.
Queensland

Because Queensland is so large, its climate varies a lot. The inland west has low rainfall and hot summers. The far north has a monsoonal 'wet' season. The coastal strip has warm subtropical conditions. Inland and in southern mountain ranges, temperatures are cooler, especially at night. Warm ocean waters influence the coastal climate. This keeps temperatures from getting too extreme and provides moisture for rain.
Queensland has five main climate zones, based on temperature and humidity:
- Hot and humid summers (far north and coast)
- Warm and humid summers (coastal hills and south-east coast)
- Hot, dry summers and mild winters (central west)
- Hot, dry summers and cold winters (southern west)
- Temperate – warm summers and cold winters (inland south-east, like the Granite Belt)

However, most people in Queensland experience two main seasons. A winter period with warm temperatures and little rain. And a humid summer period with hot, sticky temperatures and more rain.
The highest temperature ever recorded in Queensland is 49.5 °C (121.1 °F) at Birdsville on December 24, 1972. A temperature of 53.1 °C (127.6 °F) at Cloncurry on January 16, 1889, is not considered official. So, the Birdsville record is the official highest.
The lowest temperature is -10.6 °C (12.9 °F) at Stanthorpe on June 23, 1961, and at The Hermitage on July 12, 1965.

| Place | Climate type | January max. temp | January min. temp | July max. Temp | July min. temp | No. clear days | Annual precipitation |
|---|---|---|---|---|---|---|---|
| Birdsville | BWh | 39 °C (102 °F) | 24 °C (75 °F) | 21 °C (70 °F) | 7 °C (45 °F) | 221 | 164 mm (6.5 in) |
| Brisbane (capital) | Cfa | 30 °C (86 °F) | 21 °C (70 °F) | 22 °C (72 °F) | 10 °C (50 °F) | 123 | 1,022 mm (40.2 in) |
| Cairns | Am | 32 °C (90 °F) | 24 °C (75 °F) | 26 °C (79 °F) | 17 °C (63 °F) | 90 | 1,982 mm (78.0 in) |
| Gold Coast | Cfa | 29 °C (84 °F) | 22 °C (72 °F) | 21 °C (70 °F) | 12 °C (54 °F) | N/A | 1,273 mm (50.1 in) |
| Mackay | Cfa | 30 °C (86 °F) | 24 °C (75 °F) | 21 °C (70 °F) | 13 °C (55 °F) | 123 | 1,610 mm (63 in) |
| Mount Isa | BSh | 37 °C (99 °F) | 24 °C (75 °F) | 25 °C (77 °F) | 9 °C (48 °F) | 175 | 462 mm (18.2 in) |
| Rockhampton | Cfa | 32 °C (90 °F) | 22 °C (72 °F) | 23 °C (73 °F) | 10 °C (50 °F) | 116 | 812 mm (32.0 in) |
| Stanthorpe | Cfb | 27 °C (81 °F) | 16 °C (61 °F) | 15 °C (59 °F) | 1 °C (34 °F) | 42 | 762 mm (30.0 in) |
| Toowoomba | Cfa | 28 °C (82 °F) | 17 °C (63 °F) | 16 °C (61 °F) | 5 °C (41 °F) | 114 | 952 mm (37.5 in) |
| Townsville | Aw | 31 °C (88 °F) | 24 °C (75 °F) | 25 °C (77 °F) | 14 °C (57 °F) | 121 | 1,132 mm (44.6 in) |
| Weipa | Aw | 32 °C (90 °F) | 24 °C (75 °F) | 31 °C (88 °F) | 19 °C (66 °F) | 54 | 1,911 mm (75.2 in) |
South Australia

Most of South Australia has arid (very dry) and semi-dry climates. The southern coastal parts have a Mediterranean climate. This means mild, wet winters and hot, dry summers. The most rain falls along the southern coasts and the Mount Lofty Ranges. Mount Lofty itself gets about 1,200 mm (47 in) of rain annually. The least rain falls in the Lake Eyre basin, with less than 150 mm (5.9 in) annually, sometimes even less than 100 mm (3.9 in). Most rain in the southern parts of the state falls in winter. This happens when the high-pressure belt moves north over Australia.

South Australia's average temperature range is 29 °C (84 °F) in January and 15 °C (59 °F) in July. Daily temperatures in some parts of the state can reach up to 50 °C (122 °F) in January and February. The highest temperature ever recorded in Australia was 50.7 °C (123.3 °F) at Oodnadatta on January 2, 1960. The lowest temperature was -8.0 °C (17.6 °F) at Yongala on July 20, 1976.

| Place | Climate type | January max. temp | January min. temp | July max. temp | July min. temp | No. clear days | Annual precipitation |
|---|---|---|---|---|---|---|---|
| Adelaide (capital) | Csa | 29 °C (84 °F) | 17 °C (63 °F) | 15 °C (59 °F) | 7 °C (45 °F) | 87 | 551 mm (21.7 in) |
| Kingscote | Csb | 24 °C (75 °F) | 15 °C (59 °F) | 15 °C (59 °F) | 8 °C (46 °F) | 62 | 489 mm (19.3 in) |
| Mount Gambier | Csb | 25 °C (77 °F) | 11 °C (52 °F) | 13 °C (55 °F) | 5 °C (41 °F) | 40 | 710 mm (28 in) |
| Oodnadatta | BWh | 38 °C (100 °F) | 23 °C (73 °F) | 20 °C (68 °F) | 6 °C (43 °F) | 182 | 176 mm (6.9 in) |
| Port Augusta | BWh | 34 °C (93 °F) | 19 °C (66 °F) | 18 °C (64 °F) | 5 °C (41 °F) | 142 | 218 mm (8.6 in) |
| Stirling | Csb/Cfb | 25 °C (77 °F) | 12 °C (54 °F) | 11 °C (52 °F) | 5 °C (41 °F) | 71 | 1,107 mm (43.6 in) |
| Whyalla | BSh | 30 °C (86 °F) | 18 °C (64 °F) | 17 °C (63 °F) | 5 °C (41 °F) | 63 | 267 mm (10.5 in) |
Tasmania

Tasmania has a cool temperate climate, mostly an oceanic climate (Cfb). It has four clear seasons. Summer is from December to February. The average maximum sea temperature is 21 °C (70 °F). Inland areas around Launceston reach 24 °C (75 °F). Other inland areas are much cooler. Liawenee, on the Central Plateau, is one of Australia's coldest places. Its February temperatures range between 4 °C (39 °F) and 17 °C (63 °F). Autumn is from March to May. The weather changes a lot as summer patterns slowly become winter patterns.
The highest temperature ever recorded in Tasmania was 42.2 °C (108.0 °F) at Scamander on January 30, 2009. This happened during a big heat wave. Tasmania's lowest temperature ever recorded was -14.2 °C (6.4 °F) on August 7, 2020, at Liawenee.

| Place | Climate type | January max. temp | January min. temp | July max. temp | July min. temp | No. clear days | Annual precipitation |
|---|---|---|---|---|---|---|---|
| Burnie | Cfb | 21 °C (70 °F) | 13 °C (55 °F) | 13 °C (55 °F) | 6 °C (43 °F) | 52 | 958 mm (37.7 in) |
| Devonport | Csb | 21 °C (70 °F) | 12 °C (54 °F) | 13 °C (55 °F) | 5 °C (41 °F) | 56 | 773 mm (30.4 in) |
| Flinders Island | Cfb | 22 °C (72 °F) | 14 °C (57 °F) | 13 °C (55 °F) | 6 °C (43 °F) | 47 | 741 mm (29.2 in) |
| Hobart (capital) | Cfb | 22 °C (72 °F) | 12 °C (54 °F) | 12 °C (54 °F) | 5 °C (41 °F) | 41 | 615 mm (24.2 in) |
| King Island | Csb | 21 °C (70 °F) | 13 °C (55 °F) | 13 °C (55 °F) | 8 °C (46 °F) | 20 | 854 mm (33.6 in) |
| Launceston | Cfb | 25 °C (77 °F) | 11 °C (52 °F) | 12 °C (54 °F) | 2 °C (36 °F) | 50 | 630 mm (25 in) |
| Liawenee | Csc | 19 °C (66 °F) | 6 °C (43 °F) | 6 °C (43 °F) | -2 °C (28 °F) | 22 | 923 mm (36.3 in) |
| Queenstown | Cfb | 21 °C (70 °F) | 8 °C (46 °F) | 12 °C (54 °F) | 2 °C (36 °F) | 29 | 2,405 mm (94.7 in) |
| St Helens | Cfb | 23 °C (73 °F) | 13 °C (55 °F) | 14 °C (57 °F) | 5 °C (41 °F) | N/A | 666 mm (26.2 in) |
| Strahan | Cfb | 21 °C (70 °F) | 11 °C (52 °F) | 12 °C (54 °F) | 5 °C (41 °F) | 16 | 1,544 mm (60.8 in) |
Victoria

| Average monthly maximum temperature in Victoria |
||||
| Month | Melbourne | Mildura | ||
|---|---|---|---|---|
| January | 25.8 °C (78.4 °F) | 32.8 °C (91.0 °F) | ||
| February | 25.8 °C (78.4 °F) | 32.7 °C (90.9 °F) | ||
| March | 23.8 °C (74.8 °F) | 29.3 °C (84.7 °F) | ||
| April | 20.2 °C (68.4 °F) | 24.1 °C (75.4 °F) | ||
| May | 16.6 °C (61.9 °F) | 19.6 °C (67.3 °F) | ||
| June | 14.0 °C (57.2 °F) | 16.0 °C (60.8 °F) | ||
| July | 13.4 °C (56.1 °F) | 15.4 °C (59.7 °F) | ||
| August | 14.9 °C (58.8 °F) | 17.7 °C (63.9 °F) | ||
| September | 17.2 °C (63.0 °F) | 21.1 °C (70.0 °F) | ||
| October | 19.6 °C (67.3 °F) | 25.0 °C (77.0 °F) | ||
| November | 21.8 °C (71.2 °F) | 29.0 °C (84.2 °F) | ||
| December | 24.1 °C (75.4 °F) | 31.7 °C (89.1 °F) | ||
| Source: BOM | ||||
Victoria has many different climates, even though it's a small state. It ranges from semi-dry and hot in the north-west, to mild and cool along the coast. Victoria's main land feature, the Great Dividing Range, creates a cooler, mountain climate in the center and east.
The coastal plain south of the Great Dividing Range has Victoria's mildest climate. Regular weather systems from the Southern Ocean help to reduce summer heat. Melbourne and other big cities are in this mild region.
The Mallee and upper Wimmera are Victoria's warmest regions. They get hot winds from nearby deserts. Average temperatures are over 32 °C (90 °F) in summer and 15 °C (59 °F) in winter. Victoria's highest temperature ever, 48.8 °C (119.8 °F), was recorded in Hopetoun on February 7, 2009, during a big heat wave. A temperature of 50.7 °C (123.3 °F) was recorded in Mildura on January 7, 1906.
The Victorian Alps in the eastern and central regions have the coldest climate in Victoria. These Alps are part of the Great Dividing Range. Average maximum temperatures are less than 9 °C (48 °F) in winter. In the highest parts, it's below 0 °C (32 °F). The state's lowest temperature, -11.7 °C (10.9 °F), was recorded at Omeo on June 13, 1965, and again at Falls Creek on July 3, 1970.
Victoria is the wettest Australian state after Tasmania. Rainfall in Victoria increases from north to south. Higher areas get more rain. Average annual rainfall is over 1,800 mm (71 in) in some parts of the Northeast. But it's less than 250 mm (9.8 in) in the Mallee.
Rain is heaviest in the Otway Ranges on the southwest coast and West Gippsland in South-Central Victoria. It's also heavy in the mountainous Northeast. Snow often falls on the low hills in the center of the state. Rarely, it can even fall at sea level. Rain falls most often in winter, but summer rain is heavier. Rainfall is most reliable in Gippsland and the Western District. This makes them important farming areas. Victoria's highest daily rainfall ever was 375 mm (14.8 in) at Tanybryn in the Otway Ranges on March 22, 1983.

| Place | Climate type | January max. temp | January min. temp | July max. temp | July min. temp | No. clear days | Annual precipitation |
|---|---|---|---|---|---|---|---|
| Bairnsdale | Cfb | 26 °C (79 °F) | 13 °C (55 °F) | 15 °C (59 °F) | 4 °C (39 °F) | 60 | 650 mm (26 in) |
| Ballarat | Cfb | 25 °C (77 °F) | 11 °C (52 °F) | 10 °C (50 °F) | 3 °C (37 °F) | 55 | 690 mm (27 in) |
| Bendigo | Cfa/Cfb | 30 °C (86 °F) | 14 °C (57 °F) | 12 °C (54 °F) | 3 °C (37 °F) | 110 | 514 mm (20.2 in) |
| Falls Creek | Cfc | 18 °C (64 °F) | 9 °C (48 °F) | 1 °C (34 °F) | -3 °C (27 °F) | N/A | 1,274 mm (50.2 in) |
| Geelong | Cfb | 25 °C (77 °F) | 13 °C (55 °F) | 14 °C (57 °F) | 5 °C (41 °F) | 38 | 524 mm (20.6 in) |
| Melbourne (capital) | Cfb | 26 °C (79 °F) | 14 °C (57 °F) | 14 °C (57 °F) | 6 °C (43 °F) | 49 | 648 mm (25.5 in) |
| Mildura | BSk | 32 °C (90 °F) | 17 °C (63 °F) | 15 °C (59 °F) | 4 °C (39 °F) | 132 | 291 mm (11.5 in) |
| Portland | Csb/Cfb | 22 °C (72 °F) | 12 °C (54 °F) | 13 °C (55 °F) | 6 °C (43 °F) | 40 | 840 mm (33 in) |
| Shepparton | BSk | 32 °C (90 °F) | 15 °C (59 °F) | 13 °C (55 °F) | 3 °C (37 °F) | N/A | 452 mm (17.8 in) |
| Warrnambool | Cfb | 22 °C (72 °F) | 13 °C (55 °F) | 13 °C (55 °F) | 6 °C (43 °F) | 53 | 743 mm (29.3 in) |
- Temperature and precipitation for Victoria.
Source: BOM – Department of Primary Industries, Australian Natural Resources Atlas
-
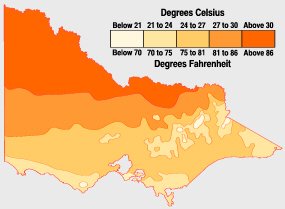
Average January temperatures: Victoria's north is always hotter than coastal and mountainous areas.
-
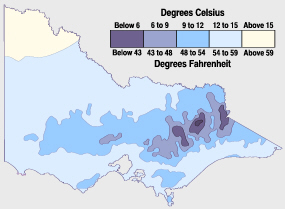
Average July temperatures: Victoria's hills and ranges are coolest during winter. Snow also falls there.
-
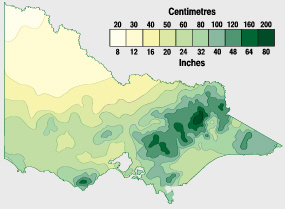
Average yearly precipitation: Victoria's rainfall is concentrated in the mountainous north-east and coast.
-
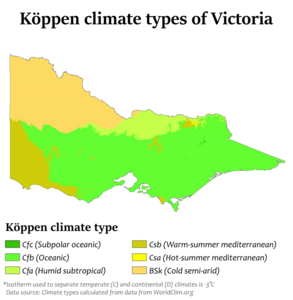
Köppen map of Victoria


Western Australia


Most of Western Australia (WA) has a hot, dry, or semi-dry climate. However, the south-west corner has a Mediterranean climate. This area used to have thick forests, including tall karri trees. This farming region of WA is one of the top nine places on Earth for land biodiversity. It has more unique species than most other similar regions. Because of the Leeuwin Current offshore, the area is also one of the top six for marine biodiversity. It has the southernmost coral reefs in the world.
Average annual rainfall ranges from 300 mm (12 in) at the edge of the Wheatbelt to 1,400 mm (55 in) in the wettest areas near Northcliffe. This is the south-westernmost tip of Australia. From November to March, even if it rains, evaporation is higher than rainfall, so it's usually very dry. Plants must be able to handle this, as well as the very poor soil. There has been a big drop in rainfall, with more rain events happening in the summer months. The central four-fifths of the state is semi-dry or desert. It has few people, and the main activity is mining. Annual rainfall averages about 200 to 250 mm (7.9 to 9.8 in). Most of this rain comes in sudden, heavy downpours during cyclone events in summer.
The northern tropical regions are an exception. The Kimberley has an extremely hot monsoonal climate. Average annual rainfall ranges from 500 to 1,500 mm (20 to 59 in). But there's a very long dry season of 7 months, from April to November. Eighty-five percent of the state's water runoff happens in the Kimberley. However, because it comes in strong floods and the soils are generally shallow and poor, development has only happened along the Ord River.

Australia's tropical/subtropical location and cold waters off the western coast make most of Western Australia a hot desert. Dryness is a key feature of most of the continent. These cold waters create very little moisture for the mainland. There are no major mountain ranges or high areas, so very little rain is caused by air rising over mountains. In the east, the Great Dividing Range stops rain from moving into inland Australia.
Snowfall in WA is rare. It usually only happens in the Stirling Range near Albany, which is the only mountain range far enough south and high enough. More rarely, snow can fall on the nearby Porongurup Range. Snow outside these areas is a big event. It usually occurs in hilly areas of south-western Australia. The most widespread low-level snow happened on June 26, 1956. Snow was reported in the Perth Hills, as far north as Wongan Hills, and as far east as Salmon Gums. Even in the Stirling Range, snowfalls rarely go over 5 cm (2.0 in) and rarely stay for more than one day.
The highest temperature recorded in WA was 50.7 °C (123.3 °F) at Onslow on January 13, 2022. The lowest temperature recorded was -7.2 °C (19.0 °F) at Eyre Bird Observatory on August 17, 2008.

| Place | Climate type | January max. temp | January min. temp | July max. temp | July min. temp | No. clear days | Annual precipitation |
|---|---|---|---|---|---|---|---|
| Albany | Csb | 23 °C (73 °F) | 15 °C (59 °F) | 16 °C (61 °F) | 8 °C (46 °F) | 45 | 929 mm (36.6 in) |
| Broome | BSh | 33 °C (91 °F) | 26 °C (79 °F) | 29 °C (84 °F) | 14 °C (57 °F) | 182 | 613 mm (24.1 in) |
| Eucla | BSk | 26 °C (79 °F) | 17 °C (63 °F) | 18 °C (64 °F) | 7 °C (45 °F) | 94 | 274 mm (10.8 in) |
| Geraldton | Csa/BSh | 32 °C (90 °F) | 18 °C (64 °F) | 19 °C (66 °F) | 9 °C (48 °F) | 164 | 441 mm (17.4 in) |
| Kalgoorlie | BSk | 34 °C (93 °F) | 18 °C (64 °F) | 17 °C (63 °F) | 5 °C (41 °F) | 151 | 266 mm (10.5 in) |
| Karratha | BSh | 36 °C (97 °F) | 27 °C (81 °F) | 26 °C (79 °F) | 14 °C (57 °F) | 158 | 297 mm (11.7 in) |
| Perth (capital) | Csa | 30 °C (86 °F) | 18 °C (64 °F) | 17 °C (63 °F) | 9 °C (48 °F) | 131 | 868 mm (34.2 in) |
| Wyndham | BSh | 37 °C (99 °F) | 26 °C (79 °F) | 31 °C (88 °F) | 17 °C (63 °F) | 176 | 824 mm (32.4 in) |
Distant Australian Islands
Australia also has several islands far from the mainland, each with its own climate.
| Island(s) | Climate type | Coordinates | January max. temp | January min. temp | July max. temp | July min. temp | No. clear days | Annual precipitation |
|---|---|---|---|---|---|---|---|---|
| Christmas Island | Am | 10°25′18″S 105°40′41″E / 10.42167°S 105.67806°E | 28 °C (82 °F) | 23 °C (73 °F) | 26 °C (79 °F) | 23 °C (73 °F) | 8 | 2,199 mm (86.6 in) |
| Cocos (Keeling) Islands | Am | 12°07′S 96°54′E / 12.117°S 96.900°E | 30 °C (86 °F) | 25 °C (77 °F) | 28 °C (82 °F) | 24 °C (75 °F) | N/A | 1,984 mm (78.1 in) |
| Lord Howe Island | Cfa | 31°33′15″S 159°05′06″E / 31.55417°S 159.08500°E | 25 °C (77 °F) | 21 °C (70 °F) | 19 °C (66 °F) | 14 °C (57 °F) | 68 | 1,464 mm (57.6 in) |
| Macquarie Island | ET | 54°30′0″S 158°57′0″E / 54.50000°S 158.95000°E | 9 °C (48 °F) | 5 °C (41 °F) | 5 °C (41 °F) | 2 °C (36 °F) | 4 | 993 mm (39.1 in) |
| Norfolk Island | Cfa | 29°02′S 167°57′E / 29.03°S 167.95°E | 25 °C (77 °F) | 19 °C (66 °F) | 18 °C (64 °F) | 14 °C (57 °F) | 41 | 1,286 mm (50.6 in) |
| Willis Island | Aw | 16°17′15″S 149°57′52″E / 16.28750°S 149.96444°E | 31 °C (88 °F) | 26 °C (79 °F) | 26 °C (79 °F) | 22 °C (72 °F) | 67 | 1,102 mm (43.4 in) |
Rainfall in Australia

More than 80% of Australia gets less than 600 mm (24 in) of rain each year. Among all continents, only Antarctica gets less rain. A place inland near Lake Eyre in South Australia might only get 81 mm (3.2 in) of rain annually. Troudaninna Bore in South Australia, from 1893 to 1936, averaged 104.9 mm (4.13 in) of rain. On the other hand, parts of the far North Queensland coast get over 4,000 mm (160 in) annually. The Australian annual record is 12,461 mm (490.6 in), set at the top of Mount Bellenden Ker in 2000.
Four main reasons make Australia so dry:
- Cold ocean currents off the west coast.
- Low height of its landforms.
- Strong high-pressure weather systems.
- The shape of the continent itself.
The average annual rainfall in the Australian desert is low, from 81 to 250 mm (3.2 to 9.8 in). Thunderstorms are fairly common, with 15 to 20 per year. Summer daytime temperatures range from 32 to 40 °C (90 to 104 °F). Winter temperatures are 18 to 23 °C (64 to 73 °F).
The southern parts of Australia get westerly winds and rain-bringing cold fronts in winter. This happens when high-pressure systems move north. Cold snaps can bring frosts inland. But temperatures near the coast stay mild all year. The Australian northwest cloudbands bring up to 80% of the yearly rain for north-western Australia. They also bring up to 40% for south-western Australia, including most winter rain. Summers in southern Australia are usually dry and hot, with cool sea breezes near the coast. During long dry spells, hot, dry winds from inland can cause bushfires. This happens most often in Victoria and New South Wales.
The tropical areas of northern Australia have a wet summer because of the monsoon. During "the wet" (typically October to April), humid north-westerly winds bring showers and thunderstorms. Sometimes, tropical cyclones bring very heavy rain to tropical coastal regions. This rain can also reach further inland. After the monsoon season, the dry season ("winter") comes. This brings mostly clear skies and milder weather.
Rainfall records are mostly found along Australia's east coast, especially in tropical north Queensland. The highest 24-hour rainfall ever in Australia was 907.0 mm (35.71 in) in Crohamhurst on February 3, 1893. The highest monthly rainfall was 5,387.0 mm (212.1 in) at Mount Bellenden Ker, Queensland, in January 1979. The highest annual rainfall was 12,461.0 mm (490.6 in), also at Mount Bellenden Ker, in 2000. The place with the highest average annual rainfall in Australia is Babinda in Queensland, with 4,279.4 mm (168.5 in) per year.
Cold ocean currents off Western Australia mean little water evaporates. So, rain clouds don't form often, and long periods of continuous rain are rare. Australia's dry/semi-dry zone extends to this region. There are no major mountain ranges or high areas. This means very little rain is caused by air rising over mountains. In the east, the Great Dividing Range stops rain from moving into inland Australia.
Australia has a compact shape. No large bodies of water go far inland. This is important because moist winds can't reach far inland, keeping rainfall low.
Snow in Australia
Snow falls often on the highlands of the southeast. This includes Victoria, New South Wales, Tasmania, and the Australian Capital Territory. There are regular snow seasons in several areas that have ski tourism, like Thredbo and Mount Buller. Snow falls regularly above 900 metres (3,000 ft) on the Great Dividing Range. It rarely falls as far north as Stanthorpe in southern Queensland. It also falls in isolated parts of South Australia and Western Australia. Outside these areas, snow is extremely rare.
Snow at sea level is sometimes seen on mainland Australia (in south-western and south-central Victoria). But it's more common in western Tasmania, where snow at sea level can happen almost every winter. Light snow generally falls once every few winters in Canberra.
Temperatures in Australia

The tropical savannah zone of Northern Australia is warm to hot all year. Summers are hot in most of the country. Average January maximum temperatures are over 30 °C (86 °F) across most of the mainland, except in high areas. Winters are warm in the north and cool in the south. Nightly frosts are common in inland areas south of the Tropic of Capricorn. Only in very high areas do winter temperatures get close to those in much of Europe or North America.
Temperatures in Australia have been increasing by about 0.7 °C (1.3 °F) between 1910 and 2004. Nighttime minimum temperatures have warmed faster than daytime maximum temperatures. This warming has sped up recently. The warming in the late 1900s is mostly due to the increased greenhouse effect. Temperature differences between winter and summer are small in tropical Australia. However, they are largest in the southern inland. Along the coast, the ocean makes seasonal differences less extreme. In July, average maximums range from 30 °C (86 °F) near the north coast to below 3 °C (37 °F) in the south-east mountains.
Average minimum temperatures in all seasons are highest in northern Australia and near coastal areas. They are lowest in the high areas of the south-east. The highest average January minimum temperatures (near 27 °C or 81 °F) are found near the north-west coast. In winter, they are over 20 °C (68 °F) in some northern coastal places and on the Torres Strait and Tiwi Islands. In the mountains of New South Wales, it's common for average low minimum temperatures to drop below 5 °C (41 °F) in January and -5 °C (23 °F) in July. Most inland (non-mountainous) areas south of the tropics have average July minimums between 0 and 6 °C (32 and 43 °F).
In the desert, the dry air and clear skies cause big temperature differences between day and night. Differences of 15 °C (27 °F) are typical, and 20 °C (36 °F) is not unusual. Light nighttime frosts in winter happen over much of the southern half of the dry zone. Here, average July minimum temperatures are mostly between 3 and 6 °C (37 and 43 °F). Moving north, frosts become rarer, with average July minimums around 10 °C (50 °F) at the northern edge.
The highest maximum temperatures in Australia are recorded in two regions. These are the Pilbara and Gascoyne regions of north-western Western Australia. The other area stretches from south-western Queensland across South Australia into south-eastern Western Australia. Many places in this region have recorded temperatures over 48 °C (118 °F). In January, average maximum temperatures are over 35 °C (95 °F) over a large inland area. They are over 40 °C (104 °F) in parts of the north-west. The highest summer maximums in the Pilbara and Gascoyne average around 41 °C (106 °F). In some years, daily maximums stay above 40 °C (104 °F) for several weeks.
Temperature Extremes
The strongest heatwave in south-eastern Australia's history happened in January 1939. Adelaide (46.1 °C or 115.0 °F on the 12th), Melbourne (45.6 °C or 114.1 °F on the 13th), and Sydney (45.3 °C or 113.5 °F on the 14th) all had record-high temperatures. Many other central areas in New South Wales, Victoria, and South Australia also set records. Melbourne's record for consecutive days over 40 °C (104 °F) is five. Brisbane had two, and Sydney had four. Heatwaves usually bring very warm nights. Oodnadatta, SA, recorded an Australian record of nine nights above 30 °C (86 °F) in February 2004. Another extreme event was a long period of heatwaves called the Angry Summer in early 2013.
Marble Bar had 160 days in a row above 37.8 °C (100.0 °F) in 1923–24. Nyang had an average maximum of 44.8 °C (112.6 °F) for February 1998 and January 2005, an Australian record. At the other extreme, average January maximums are near 15 °C (59 °F) on the highest peaks of the south-east ranges. They are near 20 °C (68 °F) in much of Tasmania. In most of the desert in summer, cool days are rare. They usually happen with major rain events. An unusual example was in February 1949. Many areas didn't reach 20 °C (68 °F) on one or more days. The maximum at Boulia, western Queensland, was 14.4 °C (57.9 °F), which was 23 °C (41 °F) below normal.
Many other places in Australia, except those above 500 meters (1,600 ft), have extreme maximums between 43 and 48 °C (109 and 118 °F). Most Tasmanian sites away from the north coast have had extreme maximums between 35 and 40 °C (95 and 104 °F). The lowest extreme maximums are along the north coast of Tasmania (e.g., 29.5 °C or 85.1 °F at Low Head) and at high elevations (27.0 °C or 80.6 °F at Thredbo). While extreme high temperatures are more common inland, notable extreme maximums have been seen near the coast. These include 50.7 °C (123.3 °F) at Onslow, 50.5 °C (122.9 °F) at Mardie, 49.9 °C (121.8 °F) at Nullarbor, South Australia, 49.8 °C (121.6 °F) at Eucla, South Australia, and 49.5 °C (121.1 °F) at Port Augusta, South Australia.
At lower elevations, most inland places south of the tropics have extreme minimums between -3 and -7 °C (27 and 19 °F). These low temperatures have also happened near southern and eastern coasts. Examples include Sale, Victoria (-5.6 °C or 21.9 °F), Bega, New South Wales (-8.1 °C or 17.4 °F), Grove, Tasmania (-7.5 °C or 18.5 °F), and Taree, New South Wales (-5.0 °C or 23.0 °F). Many places in this region have recorded -10 °C (14 °F) or lower. This includes Gudgenby in the Australian Capital Territory (-14.6 °C or 5.7 °F) and Woolbrook, New South Wales (-14.5 °C or 5.9 °F). In the desert, the lowest extreme minimums happen at high elevations, especially around Alice Springs. The temperature there has fallen as low as -7.5 °C (18.5 °F).
In the tropics, extreme minimums near or below 0 °C (32 °F) have happened in many places far from the coast. This includes as far north as Herberton, Queensland (-5.0 °C or 23.0 °F). Some places near tropical coasts, like Mackay (-0.8 °C or 30.6 °F), Townsville (0.1 °C or 32.2 °F), and Kalumburu, Western Australia (0.3 °C or 32.5 °F), have also recorded temperatures near 0 °C (32 °F). In contrast, some coastal places, like Darwin, have never fallen below 10 °C (50 °F). Thursday Island, in the Torres Strait, has an extreme minimum of 16.1 °C (61.0 °F). The lowest maximum temperature ever in Australia was -6.9 °C (19.6 °F). This was recorded on July 9, 1978, at Thredbo Ski Resort in New South Wales. The highest minimum temperature ever was 36.6 °C (97.9 °F) on January 26, 2019, at Borrona Downs Station near Wanaaring, New South Wales.
| Absolute temperature ranges | ||||||
|---|---|---|---|---|---|---|
| Month | Maximum temperatures | Minimum temperatures | ||||
| °C | °F | location and date | °C | °F | location and date | |
| January | 50.7 °C | 123.3 °F | Oodnadatta, South Australia (2 January 1960) Onslow, Western Australia (13 January 2022) |
|||
| February | 50.5 °C | 122.9 °F | Mardie, Western Australia (19 February 1998) | -7.0 °C | 19.4 °F | Perisher Ski Resort, New South Wales (17 February 1979) |
| March | 48.5 °C | 119.3 °F | Emu Creek Station, Western Australia (11 March 2019) | -7.2 °C | 19.0 °F | Kiandra, New South Wales (25 March 1964)/Bullocks Flat, New South Wales (31 March 1988) |
| April | 45.0 °C | 113.0 °F | Port Hedland, Western Australia (1 April 1948)/Marble Bar, Western Australia (2 April 1928) | -13.0 °C | 8.6 °F | Charlotte Pass, New South Wales (29 April 2009) |
| May | 40.6 °C | 105.1 °F | Bidyadanga, Western Australia (6 May 1990) | -13.4 °C | 7.9 °F | Charlotte Pass, New South Wales (24 May 2008) |
| June | 37.8 °C | 100.0 °F | Wyndham, Western Australia (2 June 1962) | -23.0 °C | -9.4 °F | Charlotte Pass, New South Wales (29 June 1994) |
| July | 37.6 °C | 99.7 °F | Wyndham, Western Australia (19 July 1996) | -19.6 °C | -3.3 °F | Charlotte Pass, New South Wales (20 July 2010) |
| August | 41.2 °C | 106.2 °F | West Roebuck, Western Australia (23 August 2020) | -20.6 °C | -5.1 °F | Charlotte Pass, New South Wales (14 August 1968) |
| September | 43.1 °C | 109.6 °F | West Roebuck, Western Australia (27 September 2003) | -16.7 °C | 1.9 °F | Charlotte Pass, New South Wales (20 September 1967) |
| October | 46.9 °C | 116.4 °F | Port Hedland, Western Australia (22 October 2002) | -12.0 °C | 10.4 °F | Charlotte Pass, New South Wales (29 October 2006) |
| November | 48.7 °C | 119.7 °F | Birdsville, Queensland (17 November 1990) | -9.4 °C | 15.1 °F | Charlotte Pass, New South Wales (26 November 1968) |
| December | 49.9 °C | 121.8 °F | Nullarbor, South Australia (19 December 2019) | -9.0 °C | 15.8 °F | Thredbo Ski Resort, New South Wales (13 December 1976) |
| Climate data for Australia | |||||||||||||
|---|---|---|---|---|---|---|---|---|---|---|---|---|---|
| Month | Jan | Feb | Mar | Apr | May | Jun | Jul | Aug | Sep | Oct | Nov | Dec | Year |
| Record high °C (°F) | 50.7 (123.3) |
50.5 (122.9) |
48.1 (118.6) |
45.0 (113.0) |
40.6 (105.1) |
37.8 (100.0) |
37.6 (99.7) |
41.2 (106.2) |
43.1 (109.6) |
46.9 (116.4) |
48.7 (119.7) |
49.9 (121.8) |
50.7 (123.3) |
| Record low °C (°F) | −7.7 (18.1) |
−7.0 (19.4) |
−7.2 (19.0) |
−13.0 (8.6) |
−13.4 (7.9) |
−23.0 (−9.4) |
−19.6 (−3.3) |
−20.6 (−5.1) |
−16.7 (1.9) |
−12.0 (10.4) |
−9.4 (15.1) |
−9.0 (15.8) |
−23.0 (−9.4) |
| Source: Bureau of Meteorology, Australian Government | |||||||||||||
Natural Hazards and Disasters
Bushfires in Australia
Climatic factors cause many bushfires in Australia, especially in summer. Low relative humidity, wind, and lack of rain can make a small fire spread very quickly. Dry plants become perfect fuel. Strong winds make flames bigger and help them travel fast and far.
Many of the worst bushfires in eastern Australia, like the 1983 Ash Wednesday fires, happen during El Niño–Southern Oscillation events. These events tend to bring warm, dry, and windy weather.
The worst bushfires in Australia's history were during the 2019–2020 Australian bushfire season, also known as "Black Summer." It lasted for 6 months and burned 140,000 km2 (55,000 mi2) of land. This was mainly in New South Wales, Victoria, Queensland, and the Australian Capital Territory. By the end, 14-34 people had died directly, hundreds more indirectly, 1-3 billion animals died, and 3,500 homes were destroyed.
Before this, the worst fires were the Black Saturday fires in February to March 2009. They caused 173 deaths and destroyed over 2,000 homes in Victoria.
Dust Storms
A dust storm or sandstorm is a weather event common in dry and semi-dry areas. It happens when strong winds pick up loose sand and dust from the dry ground. Particles are carried by jumping and floating, causing soil to be removed from one place and dropped in another.
The term sandstorm usually means dust storms in desert areas. In these, a lot of larger sand particles move close to the ground, making it hard to see. The term dust storm is more often used when finer particles are blown long distances, especially when the storm affects cities.
Drought in Australia

Drought in Australia is when rainfall over three months is in the lowest ten percent of what has been recorded for that area. This means low rainfall is relative. Rain shortages need to be compared to normal rainfall patterns, including seasonal changes. Specifically, drought in Australia is defined by a lack of rain for pastoral leases (land for grazing animals). It is decided by looking at rainfall data for a certain area.
Old weather records are now good enough to show how much the climate changes. This helps to understand what to expect for different regions. State Governments are in charge of saying when a region is affected by drought. This decision considers more than just rainfall.
Flooding in Australia
Even though most of Australia is dry or semi-dry, some regions get a lot of rain. The Wet Tropics in north-east Queensland and the western half of Tasmania both get over 1,400 mm (55 in) of rain annually, sometimes much more. Because of this, the Wet Tropics has some of Australia's only tropical rainforest. Western Tasmania has large temperate rainforests. Floods can happen in these areas at any time.
During La Niña years, Australia's eastern coast (east of the Great Dividing Range) gets more rain than average. This usually causes damaging floods. The La Niña system in 2010–2011 broke many rainfall records in Australia. This was especially true in Queensland and New South Wales. There was widespread flooding and major damage to buildings and crops. The central east area of Queensland, which is as big as Germany and France combined, was under water in 2010–11. La Niña-related flooding has affected major eastern cities like Sydney, and especially Brisbane. The 2022 eastern Australia floods were also one of the worst flood events ever recorded.
West of the Great Dividing Range, higher than average rainfall can be linked to a negative Indian Ocean Dipole. This sometimes leads to inland flooding, especially in the Murray-Darling Basin river system and its flood plains, particularly in winter.
The Top End, Kimberley, and much of North and Far North Queensland are affected by the Australian monsoon (wet season). This brings heavy rain, thunderstorms, tropical cyclones (see below), and frequent flooding from November to April. Many unsealed roads become impassable for part of the year. Because of this, these regions have large tropical savannahs.
Snowfall and Blizzards
Blizzards are not common in mainland Australia. However, they happen often in the Snowy Mountains in New South Wales and Victoria. When blizzards do occur, they can affect the Tasmanian Highlands. They especially affect Mount Wellington, which stands over Hobart, Tasmania's capital. Blizzards do not affect any major towns or cities. This is because there are no populated areas in the mountains, except for ski resort towns.
Tornadoes in Australia
In Australia, a tornado is also known as a twister or willy-willy. The first recorded tornado in Australia was in 1795. The country experiences about 60 tornadoes each year.
Tropical Cyclones

Australia is affected by tropical cyclones. These storms mostly happen between December and April. But they have sometimes formed in November and May. On average, cyclones hit mainland Australia five to six times each year. The regions between Broome and Exmouth are most likely to get cyclones. Tropical cyclones bring very strong winds, heavy rain with flooding, and storm surges along the coast. These surges cause low-lying areas to be covered in water. The strongest Australian cyclone was Cyclone Monica in 2006. It had wind gusts over 350 km/h (220 mph). Cyclones can also move inland, weakening into rain systems. These still dump heavy rain and cause flooding.
Australia's worst cyclones have caused billions of dollars in damage and many deaths. Cyclone Tracy went directly over Darwin in 1974, killing 71 people. It was Australia's most damaging cyclone. Cyclone Mahina in 1899 brought a storm surge to Far North Queensland that was 13 m (43 ft) high. This caused 400 deaths, making it Australia's worst natural disaster. Cyclone Larry hit North Queensland and passed over Innisfail in 2006. It caused an estimated A$1.5 billion in damages. However, no one died in that storm. Cyclone Yasi caused severe flooding and cost an estimated A$3.5 billion. This made it the second-most costly cyclone to hit Australia.
Climate Change in Australia

Australia's climate is changing. The average temperature has risen over the past century. This change affects rainfall patterns, leading to more extreme weather events like droughts, heatwaves, and floods. Scientists say this warming is largely due to increased greenhouse gases in the atmosphere. Understanding these changes helps us prepare for future weather.
See also
 In Spanish: Clima de Australia para niños
