
History of cartography facts for kids
The history of cartography is all about how maps and mapmaking have grown and changed over time. Maps are super important inventions. They have helped people understand and find their way around the world for thousands of years.
We don't know exactly when or how the first maps were made. But it's thought that many different cultures created their own maps of local areas. The oldest maps we still have include cave paintings and drawings on animal tusks and stones. Ancient civilizations like Babylon, Greece, Rome, China, and India made many maps.
Early maps didn't show the Earth's curve. This was because people weren't sure about the Earth's shape. Also, the curve doesn't matter much for small areas. But since the time of Classical Greece, maps of large areas, especially world maps, have used projections. These help control how the Earth's curved surface is flattened onto a map, which always causes some distortion.
Today, modern ways of travel, surveillance aircraft, and satellite imagery let us map places that were once impossible to reach. Free online tools like Google Earth now make accurate world maps easy for everyone to use.
Contents
- Ancient Maps: The Very First Maps
- Discovering the Earliest Maps
- Maps from the Ancient Near East
- Mapping the World in Ancient Greece
- Hellenistic Mediterranean: Scientific Mapping
- Roman Empire: Practical Maps
- Mapping in Ancient China
- Mapping in Japan and Korea
- Mapping in India
- Islamic Mapmaking Schools
- Medieval Europe: Symbolic Maps and New Charts
- Polynesian Stick Charts
- Modern Era: Global Exploration and Scientific Mapping
- How Map Technology Has Changed
- Images for kids
- See Also
Ancient Maps: The Very First Maps
Discovering the Earliest Maps

It's sometimes hard to tell if an old object was really a map or something else. The idea of what a "map" is can also be tricky. So, there isn't one single object everyone agrees is the oldest map. Here are some of the oldest candidates:
- A map-like drawing of a mountain, river, valleys, and paths was found in the Czech Republic. It was carved on a mammoth tusk and is about 25,000 years old.
- An Aboriginal Australian object called a cylcon might be 20,000 years old. It is thought to show the Darling River.
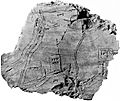
- A map etched on a mammoth bone from Mezhyrich is about 15,000 years old.
- Dots from 14,500 BC in the Lascaux caves might map part of the night sky. They seem to show stars like Vega, Deneb, and Altair (the Summer Triangle). The Cuevas de El Castillo in Spain has a dot map of the Corona Borealis constellation from 12,000 BC.
- A polished stone from a cave in Spanish Navarre, from 14,000 BC, might show hills or homes. Or it could be a spiritual map or just simple carvings.
- Another old picture that looks like a map was made around 7000 BC in Çatalhöyük, Anatolia, modern Turkey. This wall painting might be a plan of the village. However, some experts now question if it's truly a map.
- The "Saint-Bélec slab" (2200–1600 BC) has lines and symbols. Some believe it shows a land plan of part of western Brittany.
Maps from the Ancient Near East
.jpg)
Maps in ancient Babylon were made using good surveying methods. For example, a small clay tablet found in 1930 shows a river valley between two hills. It has Cuneiform writing that names features, including a plot of land owned by someone named Azala. Most experts think this tablet is from the 25th to 24th century BC. Hills are shown with overlapping semicircles, rivers with lines, and cities with circles. The map also shows the cardinal directions.
The Babylonian World Map, from around 600 BC, is the oldest surviving world map. It's more symbolic than a true picture. It leaves out groups like the Persians and Egyptians, even though Babylonians knew them well. The map shows the world as a circle surrounded by water. This fits the religious beliefs of the Babylonians.
Phoenician sailors were great explorers. It's believed they might have sailed all the way around Africa around 610–595 BC. This was done for the Egyptian pharaoh Necho II. The historian Herodotus wrote about this. He doubted the report that the Sun was seen shining from the north. But to modern historians, this detail actually proves the Phoenicians' story. It even suggests they might have known the Earth was a sphere.
Mapping the World in Ancient Greece
Many scholars, like Strabo and Dilke, think Homer was the first to shape how early Greeks saw the Earth. Homer imagined the Earth as a flat disk surrounded by a flowing river of Ocean. This idea came from how the horizon looks from a mountain or the sea. Early Greeks accepted this model. Homer and his people knew little about the world beyond Egypt, Asia Minor, and Greece. His poems don't even mention Europe or Asia as continents.
Hesiod's poems, from the 8th century BC, also talk about geography. He names rivers like the Nile and Ister (Danube), and places like the Bosporus and the Black Sea. His knowledge helped create the first Greek world maps. Mapmakers like Anaximander, Hecataeus of Miletus, and Ptolemy used observations and math to make their maps.
The first ancient Greek said to have made a world map was Anaximander of Miletus (around 611–546 BC). He thought the Earth was a cylinder floating in space. The part where people lived was circular and disk-shaped, on the top of the cylinder. Anaximander is often called the first mapmaker, but his map is lost.
Hecataeus of Miletus (550–475 BC) made another map fifty years later. He said it was an improved version of Anaximander's.

Hecataeus's map showed the Earth as a disk with the Ocean around it, and Greece in the middle. This was a common Greek view, from Homer's poems. Like many early maps, it had no scale. It used "days of sailing" or "days of marching" to measure distances. This map went with Hecataeus's book, Periodos Ges, or Journey Round the World. This book was split into "Europe" and "Asia" (which included Libya, an old name for Africa).
Hecataeus divided the world into two continents: Asia and Europe. He used the Pillars of Hercules, the Bosporus, and the Don River as boundaries. He was the first to think the Caspian Sea flowed into the ocean. He knew a lot about the Black Sea. North of the Danube, he placed the Rhipæan Mountains and the Hyperboreans, people of the far north. He thought the Nile River started from the southern ocean, which helped him explain its yearly flooding. His map was meant to help with political decisions.

Anaximenes of Miletus (6th century BC), who studied with Anaximander, thought the Earth was a rectangle supported by compressed air.
Pythagoras of Samos (around 560–480 BC) thought the Earth was a sphere with a fire at its center. He is sometimes wrongly credited with dividing the Earth into five zones: one hot, two mild, and two cold. This idea, called the zonal theory of climate, probably came from the time of Aristotle.
Scylax, a sailor, wrote about his Mediterranean trips around 515 BC. These were the first Greek periploi, or sailing guides. They became very important for later mapmakers.

Herodotus traveled widely, gathering information for his books on Europe, Asia, and Libya. He also learned from people he met. His Histories, written in the mid-5th century BC, give a detailed picture of the world he knew.
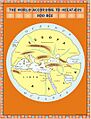
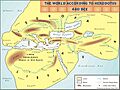
Herodotus didn't believe the Earth was a disk surrounded by ocean. He described it as an irregular shape with oceans only around Asia and Africa. He named the Atlantic Sea and the Erythrean Sea (Red Sea). He divided the world into Europe, Asia, and Africa. He thought Europe was much larger than people believed.
He believed Africa was surrounded by water, except for a small part near Suez. He based this on the story of Pharaoh Necho II, who sent Phoenicians to sail around Africa. This trip took three years and proved his idea. Herodotus also thought the Nile River started as far west as the Ister River in Europe. He was the first to realize the Caspian Sea was separate from other seas.
Herodotus also made mistakes. He thought the world got stranger the further you traveled from Greece, with people becoming more savage.
While many Greek thinkers thought the Earth was a sphere, Aristotle (384–322 BC) is known for proving it. His reasons included:
- Lunar eclipses always show a circular shadow.
- Ships seem to sink as they sail away, disappearing over the horizon.
- Some stars can only be seen from certain parts of the Earth.
Hellenistic Mediterranean: Scientific Mapping
A huge step in mapping was the scientific estimate of the Earth's size. Eratosthenes (275–195 BC), a Greek scholar in North Africa, did this. He was the first to calculate the Earth's circumference very accurately (within 0.5 percent).
Eratosthenes's big achievement was using a new way of mapping with meridians (imaginary north–south lines) and parallels (imaginary west–east lines). These lines divided the world into sections, helping him pinpoint places. He also divided the Earth into five climate zones: a hot zone in the middle, two cold zones at the poles, and two mild zones in between. He was probably the first to use the word "geography."
Roman Empire: Practical Maps
Pomponius Mela's World View

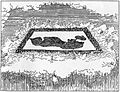
Pomponius Mela was a unique ancient geographer. He divided the Earth into five zones, with only two being livable. He believed in antichthones, people living in the southern mild zone, who couldn't reach the northern zone because of the hot middle belt. He repeated Eratosthenes's ideas about Europe, Asia, and Africa. Like most ancient geographers, he thought the Caspian Sea was an inlet of the Northern Ocean.
Marinus of Tyre: Mathematical Geography
Marinus of Tyre was a Greek-speaking Phoenician geographer. He started mathematical geography and laid the groundwork for Ptolemy's famous Geographia.
Marinus's writings are lost, but we know about them from Ptolemy. He improved mapmaking and created a system of nautical charts. His main contribution was being the first to give every place a proper latitude and longitude. His zero meridian (the starting line for longitude) went through the westernmost land he knew, the Isles of the Blessed (around the Canary or Cape Verde Islands). He used the parallel of Rhodes for latitude measurements.
Marinus estimated the equator's length to be about 33,300 km, which was about 17% less than the real value. He also studied earlier works and travel diaries. His maps were the first in the Roman Empire to show China. He also invented equirectangular projection, a map style still used today. Marinus believed the World Ocean was split into eastern and western parts by Europe, Asia, and Africa. He also created the term Antarctic.
Ptolemy: The Father of Modern Mapping
Ptolemy (90–168 AD), an Egyptian-Greek scholar, believed that with astronomy and math, the Earth could be mapped very accurately. He changed how the spherical Earth was shown on a flat map by using perspective projection. He also suggested exact ways to find places using a coordinate system with parallels of latitude and meridians of longitude.
Ptolemy's eight-volume atlas Geographia is like an early version of modern mapping and GIS. It had an index of place-names with their latitude and longitude. It also included scale, symbols with explanations, and the practice of putting north at the top and east to the right – a common practice today.
However, Ptolemy made a big mistake: he miscalculated the Earth's circumference. He thought Eurasia covered 180° of the globe. This mistake later convinced Christopher Columbus to sail west across the Atlantic to find a quicker way to India. If Columbus had known the true size, he might never have started his famous journey.
The Tabula Peutingeriana: A Roman Road Map

In 2007, the Tabula Peutingeriana was recognized by UNESCO. It's a 12th-century copy of a 5th-century Roman road map. This long scroll is well-preserved and thought to be an accurate copy of the original. It's now very delicate and must be protected from daylight.
Mapping in Ancient China
The oldest maps found in China date back to the 4th century BC. In 1986, seven ancient Chinese maps were found in a tomb from the Qin State. Before this, the oldest known maps were from the Mawangdui Han tomb (2nd century BC). The Qin maps were drawn with black ink on wooden blocks. They survived because underground water seeped into the tomb.
The seven Qin maps overlap. They show river systems in Sichuan, covering a large area. They use rectangles with names for administrative areas. Rivers and roads are shown with similar lines, which can make them hard to read. But river labels help modern mapmakers. These maps also show where different types of wood could be found. Two maps even give distances to these wood sites. This means they might be the oldest economic maps in the world.
A fragment of a paper map was also found in a tomb from the early Western Han dynasty (early 2nd century BC). It shows mountains, waterways, and roads, and is thought to cover the area of the Qin Kingdom.
Early Chinese Geographical Writing
The earliest known Chinese writing about geography is from the 5th century BC. This was the Yu Gong or Tribute of Yu chapter in the Shu Jing (Book of Documents). It describes nine provinces, their soil, products, trade, and rivers. These provinces were much smaller than modern Chinese ones.
Han Dynasty Maps

The three Han dynasty maps from Mawangdui are different from the Qin maps. Qin maps had north at the top, but Han maps had south at the top. Han maps are also more complex. They cover a larger area, use many symbols, and include military sites and population info. They note distances, but a formal grid system wasn't fully described until the 3rd century.
One Han map showed the tomb area. A larger map showed the Han borders with the Kingdom of Changsha and the Nanyue kingdom (parts of modern Guangdong and Guangxi). Another map marked Han military bases used in an attack against Nanyue in 181 BC.
The Rites of Zhou mentioned maps used for government provinces, districts, and borders. By 117 BC, Emperor Wu of Han asked for maps of the entire empire.
From the 1st century AD, Chinese history books had a geography section. These sections listed changes in place-names, administrative divisions, mountains, rivers, and products. Chinese geographical writing became more factual and less legendary. For example, the Huainanzi (139 BC) described topography systematically, using maps.
Pei Xiu: The 'Ptolemy of China'
In 267 AD, Pei Xiu (224–271) became the Minister of Works. He is famous for his work in cartography. While maps and grids existed before him, he was the first to describe using a geometric grid and scale on maps for better accuracy. Pei listed six rules for making maps, including the rectangular grid and scale. Western historians compare him to the Greek Ptolemy.
Pei Xiu said that older Han maps were inaccurate. However, the Qin State maps and Mawangdui maps were actually much better than he thought. Pei Xiu's main improvement was showing elevation on maps.
Sui and Tang Dynasties
In 605 AD, during the Sui dynasty, Pei Ju created a famous gridded map. In 610, Emperor Yang of Sui ordered officials to make detailed maps and descriptions of their local areas.
The Tang dynasty also had important mapmakers. Jia Dan (730–805) was a great geographer. In 785, he was asked to complete a map of China and its colonies. This huge map, finished in 801, was called the Hai Nei Hua Yi Tu (Map of both Chinese and Barbarian Peoples within the (Four) Seas). It was 30 feet long and 33 feet high, using a grid scale where one inch equaled 100 li (unit) (like a Chinese mile).
Song Dynasty Maps

During the Song dynasty, Emperor Taizu of Song ordered Lu Duosun to update all maps in 971. With help from Song Zhun, this huge work was finished in 1010, with 1566 chapters.
There were also large, detailed stone maps during the Song period. For example, a 3-foot square stone map from 1137 shows incredible detail of China's coast and rivers. It shows 500 settlements and extends to Korea and India.
The famous scientist Shen Kuo (1031–1095) was also a geographer. His atlas had 23 maps of China and other regions, all at a scale of 1:900,000. Shen also made a 3D raised-relief map using sawdust, wood, beeswax, and wheat paste.
Yuan and Ming Dynasty Maps
In the Mongol Empire, Mongol, Persian, and Chinese mapmakers created maps and travel accounts. The Mongols required conquered nations to send maps to their headquarters. Thanks to the Pax Mongolica, people from East and West could share geographical information.
The Yuan dynasty published a map of the whole Mongol world around 1330, called "Hsi-pei pi ti-li tu." It included Mongol lands, cities in Iran, Russia, and neighboring countries like Egypt and Syria.
The colorful Da Ming Hunyi Tu map from the early Ming dynasty (around 1390) is very detailed. Many old Chinese maps from the 16th-17th centuries still exist. Jesuit missionaries also helped create maps like the Kunyu Wanguo Quantu (1602), which influenced maps in Japan and Korea.
In 1579, Luo Hongxian published the Guang Yutu atlas. It had over 40 maps, a grid system, and a clear way to show mountains, rivers, roads, and borders. This atlas included discoveries from Zheng He's 15th-century sea voyages.
Mapping in Japan and Korea


In 1402, Yi Hoe and Kwan Yun created the Gangnido map, a world map based on Chinese maps. It's one of the oldest surviving world maps from East Asia. Another important map is the Cheonhado map, made in Korea in the 17th century.
Sekisui Nagakubo made a world map in Japan in 1785. It was based on an earlier map by Matteo Ricci. This was one of the first Japanese maps with longitude and latitude.
Inō Tadataka was a famous Japanese mapmaker from the late-Edo period. He made the first map of Japan using modern surveying. His most famous work, the Dai Nihon Enkai Yochi Zenzu, was incredibly accurate.
Mapping in India
Ancient Indian Maps
Indian map traditions included showing the Pole star and other constellations for navigation. Detailed maps showed settlements, coastlines, rivers, and mountains. The 8th-century scholar Bhavabhuti drew pictures that showed geographical regions.
Italian scholar Francesco Lorenzo Pullè reproduced many ancient Indian maps. The early Encyclopædia Britannica also described maps made by the Dravidian people of India.
Mughal Era Maps
Maps from the Ain-e-Akbari, a Mughal document, mention locations from earlier Indian maps. A map of the kingdom of Nepal, about four feet long, was given to Warren Hastings. It showed mountains raised from the surface and different features in different colors.
The scholar Sadiq Isfahani made an atlas of the world's "livable" parts. This 32-sheet atlas, from 1647, had maps oriented south, like many Islamic works. The largest known Indian map, showing the former Rajput capital at Amber in great detail, was huge: 661 × 645 cm (about 22 × 21 feet).
Islamic Mapmaking Schools
Arab and Persian Maps

In the Middle Ages, Muslim scholars continued and improved mapmaking. Most used Ptolemy's methods. They also used information from explorers and merchants who traveled across the Muslim world and traded with China and Russia.
Al-Ma'mun, an Abbasid caliph (813–833), was very important for mapmaking. He asked geographers to remeasure the distance on Earth for one degree of celestial meridian. This helped refine the Arab mile (mīl). These efforts also allowed Muslims to calculate the Earth's circumference. Al-Ma'mun also ordered a large world map, which is now lost.
In the 9th century, the Persian mathematician and geographer, Habash al-Hasib al-Marwazi, used spherical trigonometry to convert coordinates to a system centered on Mecca. Abū Rayhān Bīrūnī (973–1048) later developed similar ideas.
In the early 10th century, Abū Zayd al-Balkhī started the "Balkhī school" of mapping in Baghdad. Geographers from this school wrote about Muslim lands, but not much about non-Muslim areas. They made world atlases with a world map and twenty regional maps.
Suhrāb, a 10th-century Muslim geographer, wrote instructions for making a rectangular world map. The oldest surviving rectangular map is from the 13th century.
Ibn Battuta (1304–1368?) wrote "Rihlah" (Travels) based on his three decades of journeys. He covered over 120,000 km across North Africa, Southern Europe, and much of Asia.
Book on the Appearance of the Earth
Muhammad ibn Mūsā al-Khwārizmī's Kitāb ṣūrat al-Arḍ ("Book on the appearance of the Earth") was finished in 833. It was an updated version of Ptolemy's Geography.
Al-Khwārizmī corrected Ptolemy's big mistake about the length of the Mediterranean Sea. Ptolemy thought it was 63 degrees of longitude, but al-Khwarizmi correctly estimated it at almost 50 degrees. Al-Ma'mun's geographers also showed the Atlantic and Indian Oceans as open waters, not landlocked seas like Ptolemy did.
Al-Biruni's Contributions
Abu Rayhan al-Biruni (973–1048) estimated the Earth radius to be 6,339.6 km, which is very close to the modern value. He developed a new method to measure the Earth's circumference using trigonometric calculations from a mountain top. This was the first known use of dip angle and the first practical use of the law of sines.
Around 1025, Al-Biruni was the first to describe a polar equi-azimuthal equidistant projection of the celestial sphere.
In his Codex Masudicus (1037), Al-Biruni thought there might be a landmass in the vast ocean between Asia and Europe. He figured this out from his accurate estimates of the Earth's circumference and the size of Afro-Eurasia. He also thought this landmass would be inhabited. He was the first to predict "the existence of land to the east and west of Eurasia, which later on was discovered to be America and Japan."
The Tabula Rogeriana

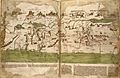
The Arab geographer, Muhammad al-Idrisi, created his medieval atlas, Tabula Rogeriana, in 1154. He combined knowledge from Arab merchants and explorers with classical geography. This created the most accurate world map of its time. With money from Roger II of Sicily, al-Idrisi used knowledge from the university of Cordoba and paid artists to map their routes. The book describes the Earth as a sphere and maps it in 70 rectangular sections. It correctly shows the two sources of the Nile and mentions Norway.
Al-Idrisi's atlas was a major tool for Italian, Dutch, and French mapmakers from the 16th to 18th centuries.
Piri Reis Map of the Ottoman Empire

The Ottoman mapmaker Piri Reis published navigational maps in his Kitab-ı Bahriye. This work included an atlas of charts for the Mediterranean, with sailing instructions. In a later version, he added a map of the Americas. The Piri Reis map, drawn in 1513, is one of the oldest surviving maps to show the Americas.
Medieval Europe: Symbolic Maps and New Charts

Medieval Maps and the Mappa Mundi
Medieval world maps in Europe were mostly symbolic, like the much older Babylonian World Map. These maps, called Mappa Mundi (cloths or charts of the world), were circular or symmetrical diagrams. They showed the Earth's single landmass as a disk surrounded by ocean.
.jpg)
Italian Cartography and Portolan Charts
Roger Bacon studied map projections. Then, portolano and portolan charts appeared for European trade routes. These were rare new ideas for the time. The Carta Pisana portolan chart, made in the late 13th century, is the oldest surviving nautical chart. It shows accurate directions for sailing.
Majorcan Cartographic School


The Majorcan cartographic school was a group of mapmakers, astronomers, and instrument makers in Majorca. They were mostly Jewish. With their diverse background, they tried new mapmaking techniques, especially for the Mediterranean. The Catalan Atlas is an example. The Majorcan school helped invent the "Normal Portolan chart" around 1300. This was a very good, detailed nautical map with compass lines.
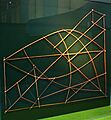
Polynesian Stick Charts

The Polynesian people explored and settled the Pacific islands. They used maps to navigate long distances. A map from the Marshall Islands uses sticks tied in a grid. Palm strips show wave and wind patterns, and shells show island locations. Other maps were made as needed using stones or shells.
Modern Era: Global Exploration and Scientific Mapping
Iberian Cartography in the Age of Exploration
During the Renaissance, people became interested in classical works again. Maps started to look more like surveys. European exploration of the Americas and their efforts to control these lands brought back interest in scientific mapping. Peter Whitfield, a map historian, says European mapmaking helped spread Western power. He noted that "Men in Seville, Amsterdam or London had access to knowledge of America, Brazil, or India, while the native peoples knew only their own immediate environment."
In the 15th and 16th centuries, Spain and Portugal led European overseas exploration. They mapped the coasts of the Americas, Africa, and Asia during the Age of Discovery. Spain and Portugal attracted talented scientists and technology from Italian city-states.
Portugal's expeditions began in 1419 along West Africa. Bartolomeu Dias reached the Cape of Good Hope in 1488. Ten years later, Vasco da Gama led the first fleet around Africa to India. Explorations then went to Southeast Asia, reaching Ming China and Japan (1542).

In 1492, Christopher Columbus sailed west for Spain to find a new trade route to Asia. He accidentally found the Americas. The Spanish mapmaker and explorer Juan de la Cosa sailed with Columbus. He made the first known maps showing both the Americas. The time after 1492 is called the Columbian Exchange. It was a huge exchange of animals, plants, culture, people, diseases, and ideas between the Americas and Afro-Eurasia.
The Magellan-Elcano circumnavigation was the first known voyage around the world. This Spanish expedition sailed from Seville in 1519. After Ferdinand Magellan died in the Philippines, Juan Sebastián Elcano took command. They returned to Spain in 1522, three years after they left.
- Around 1485: Portuguese mapmaker Pedro Reinel made the oldest known signed Portuguese nautical chart.
- 1492: Jorge de Aguiar made the oldest known signed and dated Portuguese nautical chart.
- 1537: Much of Portuguese mathematician Pedro Nunes' work was about navigation. He was the first to understand why a ship keeping a steady course would not travel along a great circle (the shortest path). Instead, it would follow a spiral course, called a loxodrome. In his Treatise in Defense of the Marine Chart (1537), Nunes said a nautical chart should have straight parallels and meridians. He wasn't sure how to solve the problems this caused until Mercator developed his famous projection. The Mercator Projection is still used today.
First Maps of the Americas

- 1500: The Spanish mapmaker Juan de la Cosa created the first known maps showing both the Americas, as well as Africa and Eurasia.
- 1502: An unknown Portuguese mapmaker made the Cantino planisphere. This was the first nautical chart to clearly show latitudes.
- 1504: Portuguese mapmaker Pedro Reinel made the oldest known nautical chart with a scale of latitudes.
- 1519: Portuguese mapmakers Lopo Homem, Pedro Reinel, and Jorge Reinel made the maps known as the Miller Atlas.
- 1530: Alonzo de Santa Cruz, a Spanish mapmaker, made the first map of magnetic variations from true north. He thought it would help find the correct longitude.
Padrón Real of the Spanish Empire


Founded in 1504 in Seville, the Spanish House of Trade had many mapmakers. They kept a royal standard map that was updated as new information came from expeditions. This was similar to Portugal's practice.
The original Spanish and Portuguese maps are lost. But copies are held in the Vatican Library and other places. The 1527 and 1529 copies of the Padrón Real, by Diogo Ribeiro, are praised as the first scientific world maps. They show the full Pacific Ocean and the continuous coast of North America for the first time.
Two important mapmakers of the House of Trade were Alonso de Santa Cruz and Juan López de Velasco. They directed mapmaking without ever going to the New World. Their maps were based on information from returning sailors.
German Cartography


- 15th century: The German monk Nicolaus Germanus wrote a pioneering Cosmographia. He added new maps to Ptolemy's Geographica. Germanus invented the Donis map projection.
- 1492: German merchant Martin Behaim (1459–1507) made the oldest surviving terrestrial globe, but it didn't include the Americas.
- 1507: German mapmaker Martin Waldseemüller's world map was the first to use the term America for the Western continents (after explorer Amerigo Vespucci).
- 1603: German Johann Bayer's star atlas (Uranometria) was published. It was the first atlas to cover the entire celestial sphere.
Dutch and Flemish Cartography
.jpg)

Leuven, Antwerp, and Amsterdam were key centers for Dutch and Flemish mapmaking in its golden age (16th and 17th centuries). This period saw the creation of huge, multi-volume world atlases.
Gerardus Mercator was a German-Netherlandish mapmaker. His greatest legacy was the mathematical projection he created for his 1569 world map. This projection makes meridians straight and perpendicular to parallels. It stretches the map as it goes towards the poles. Mercator made sure that the stretching exactly balanced the increasing length of parallels. This kept the shapes of small regions correct, even though it distorted the overall globe. This type of map makes rhumb lines (sailing courses with a constant bearing) into straight lines, which greatly helps navigation.
Mercator spent his last thirty years working on a huge project, the Cosmographia. The word atlas first appeared in the title of the final volume.

Abraham Ortelius is known as the creator of the first modern atlas, the Theatrum Orbis Terrarum. Triangulation (a method of surveying) first appeared in the early 16th century. The Dutch mapmaker Jacob van Deventer was among the first to use triangulation systematically.
The modern use of triangulation networks comes from the work of the Dutch mathematician Willebrord Snell. In 1615, he surveyed the distance between two towns using a chain of triangles. From this, he calculated the Earth's circumference.
The first printed atlas of nautical charts (De Spieghel der Zeevaerdt or The Mirror of Navigation) was made by Lucas Waghenaer in 1584. This was the first attempt to organize nautical maps systematically.
In 1660, the German-born Dutch mapmaker Andreas Cellarius had his star atlas (Harmonia Macrocosmica) published.
Competition between mapmaking firms like Blaeu and Janssonius led to the Atlas Maior or 'Major Atlas'. In 1662, Joan Blaeu's Latin edition appeared in eleven volumes with about 600 maps. This atlas was a huge success and a status symbol for rich citizens. However, it also marked the end of the golden age of Dutch cartography.
French Cartography
The reign of Louis XIV is seen as the start of cartography as a science in France. Maps changed from just showing borders to being tools for controlling territory. Louis XIV and his court pushed for scientific development, especially in cartography. Louis XIV created the Académie des Sciences in 1666 to improve mapmaking and sailing charts.
Jean-Baptiste Colbert, a key member of Louis XIV's court, wanted to develop France's resources and infrastructure. He needed a map of the entire country, which didn't exist. The Académie des Sciences made breakthroughs in cartography. Giovanni Domenico Cassini perfected a way to find longitude by observing Jupiter's moons. Cassini and Jean Picard developed a system of surveyed triangles to combine provincial information into a full map of the country. This practice was later adopted by other nations.
In the 1670s, Giovanni Domenico Cassini began work on the first modern topographic map in France. His grandson, Cassini de Thury, completed it in 1789 or 1793.
Paris: Center of Map Trade
The 17th century saw France become the center of the map trade in Europe, with most map production in Paris. Royal support attracted artists and mapmakers to Paris. Many mapmakers, like Nicolas Sanson, moved to the capital.
Many Parisian mapmakers, called geographes de cabinet, never left the city. They gathered information from old and new sources, both written and visual.
Dieppe School of Cartographers
The Dieppe maps are a series of world maps made in Dieppe, France, in the mid-16th century. They were large, handmade maps for wealthy and royal patrons. The Dieppe school of cartographers included Pierre Desceliers and Johne Rotz.
18th-Century Map Developments

The Vertical Perspective projection was first used by German map publisher Matthias Seutter in 1740. This is the type of projection used by Google Earth today.
The French astronomer Joseph-Nicolas Delisle created the final form of the equidistant conic projection in 1745.
The Swiss mathematician Johann Lambert invented several map projections in 1772, including the Lambert conformal conic and Lambert azimuthal equal-area projections.
The Albers equal-area conic projection was invented by Heinrich Albers in 1805.
In 1715, Herman Moll published the Beaver Map, a famous early map of North America.
In 1763–1767, Captain James Cook mapped Newfoundland.
In 1777, Colonel Joseph Frederick Wallet DesBarres created a huge four-volume atlas of North America, Atlantic Neptune.
_(2674893303).jpg)
In the United States, explorers mapped trails and army engineers surveyed government lands. Agencies like the U.S. Geological Survey were set up for more detailed mapping.
19th-Century Map Developments

During his travels in Spanish America (1799–1804), Alexander von Humboldt created the most accurate map of New Spain (now Mexico) at that time. His Carte du Mexique (1804) was based on existing maps but with careful attention to latitude and longitude.
John Disturnell published Mapa de los Estados Unidos de Méjico. This map was used in the negotiations between the U.S. and Mexico for the Treaty of Guadalupe Hidalgo (1848), after the Mexican–American War.
The Greenwich prime meridian became the international standard for mapmakers in 1884.
20th-Century Map Developments
In the 20th century, maps became more common. This was thanks to better printing and photography, which made production cheaper. Airplanes made it possible to photograph large areas at once.
Two-point equidistant projection was first drawn by Hans Maurer in 1919. The loximuthal projection was created by Karl Siemon in 1935.
Since the mid-1990s, computers have helped store, sort, and arrange data for mapping. This has made map projections much easier to create.
Contemporary Map Developments
Software for Maps
Today, mapmaking relies heavily on computer software. This trend started in the late 20th century. Software helps with finding your location, searching for places, and calculating distances. Big companies like Google Maps, Apple Maps, and Bing Maps offer services worldwide. Many other local and smaller companies also offer map services. The list of online map services is long and growing.
Historical Map Collections
Recent developments include combining old maps with modern research and computer software. This creates historical maps that show changes over time. Initiatives like Euratlas History Maps cover Europe from 1 AD to today. These maps show how countries, provinces, and cities have changed.
Today, historical cartography is growing. Map services are becoming more specialized. New map projections are still being developed. University map collections, like the Perry–Castañeda Library Map Collection, offer more diverse maps and tools. The David Rumsey Historical Map Collection is also well-known.
Self-Publishing and Collaborative Mapping
Never before have there been so many "edit-yourself" map tools for non-experts. Map blogs and self-publishing are common. In 2004, Steve Coast created OpenStreetMap. This is a collaborative project to create a free editable map of the world. OpenStreetMap grew because of limits on using other map information and the rise of cheap satellite navigation devices.
Map Organizations
In 1921, the International Hydrographic Organization (IHO) was set up. It sets standards for hydrographic surveying and nautical charting.
How Map Technology Has Changed

In mapmaking, technology has always changed to meet new needs. The first maps were drawn by hand on parchment. They varied in quality and were hard to copy. The invention of the compass, printing press, telescope, sextant, and quadrant allowed for much more accurate maps and easy copies.
Later, advances in chemical technology, like lithographic and photochemical processes, led to maps with fine details. These maps didn't distort and resisted moisture. This also removed the need for engraving, making map production faster.

In the mid-to-late 20th century, electronic technology changed mapmaking even more. Computer hardware like screens, plotters, and scanners, along with software for visualization and analysis, made mapmaking much more accessible. It became easier to create maps showing slightly different features without making a new printing plate.
Aerial photography and satellite imagery provide very accurate ways to map physical features over large areas. This includes coastlines, roads, buildings, and land shapes.
Images for kids
-
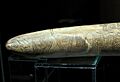
Possibly the oldest surviving map has been engraved on this mammoth tusk, dated to 25,000 BC, found from Pavlov in the Czech Republic.
-
Clay tablet with map of the Babylonian city of Nippur (c. 1400 BC).
-
The world according to Hekatæus, 500 BC.
-
The world according to Anaximenes, c. 500 BC.
-
The world according to Herodotus, 440 BC.
-
Reconstruction of Pomponius Mela's world map.
-
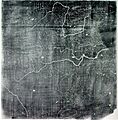
An early Western Han dynasty (202 BC – 9 AD) silk map found in tomb 3 of Mawangdui Han tombs site, depicting the Kingdom of Changsha and Kingdom of Nanyue in southern China (note: the south direction is oriented at the top, north at the bottom).
-
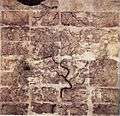
The Yu Ji Tu, or Map of the Tracks of Yu Gong, carved into stone in 1137, located in the Stele Forest of Xi'an. This 3 ft (0.91 m) squared map features a graduated scale of 100 li for each rectangular grid. China's coastline and river systems are clearly defined and precisely pinpointed on the map. Yu Gong is in reference to the Chinese deity described in the geographical chapter of the Classic of History, dated 5th century BC.
-
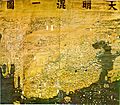
The Da Ming Hun Yi Tu map, dating c. 1390, exists in multicolour format.
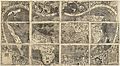
-
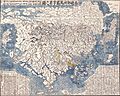
The first Japanese printed map to depict the world, including Europe and America. Printed by woodblock in 1710, composed by the Buddhist monk Rokashi Hotan.
-
Map of the “Inhabited Quarter” by Sadiq Isfahani from Jaunpur c.1647. This was one of the only surviving Indian made maps.
-
The pundit (explorer) cartographer Nain Singh Rawat (19th century) received a Royal Geographical Society gold medal in 1876.
-
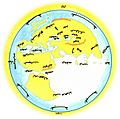
Al-Masudi's world map (10th century).
-
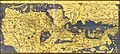
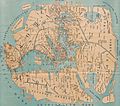
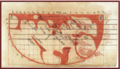
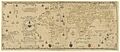
The Tabula Rogeriana, drawn by Muhammad al-Idrisi for Roger II of Sicily in 1154. Note that the north is at the bottom, and so the map appears "upside down" compared to modern cartographic conventions.
-
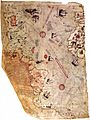
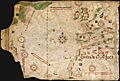
Surviving fragment of the first World Map of Piri Reis (1513) showing parts of the Americas.
-
The Gough Map, a road map of 14th-century Britain.
-
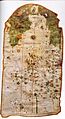
Map of the Holy Land, Pietro Vesconte, 1321. Described by Adolf Erik Nordenskiöld as "the first non-Ptolemaic map of a definite country".
-
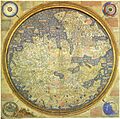
The Fra Mauro map, a medieval European map, was made around 1450 by the Italian monk Fra Mauro. It is a circular world map drawn on parchment and set in a wooden frame, about two meters in diameter.
-
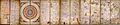
Catalan Atlas drawn and written in 1375, conserved in the Bibliothèque nationale de France. (Scroll left or right).
-
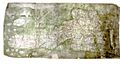
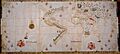
A chart of an unidentified area.
-
World Map by Juan de la Cosa (1500), the first map showing the Americas.
-
Nautical chart by Pedro Reinel (c. 1504), one of the first based on astronomical observations and to depict a scale of latitudes.
-
The Salviati Planisphere, a 1526 version of the Padrón Real provided by Charles V to the cardinal who officiated his wedding to Isabella of Portugal.
-
The Propaganda Map, a 1529 version of the Padrón Real now held by the Vatican Library.
-
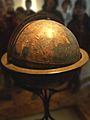
Martin Behaim's Erdapfel (1492) is considered to be the oldest surviving terrestrial globe.
-
Universalis Cosmographia, the Waldseemüller wall map dated 1507, depicts the Americas, Africa, Europe, Asia, and the Pacific Ocean separating Asia from the Americas, by the Italian Amerigo Vespucci.
-
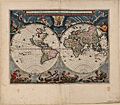
Blaeu's world map, originally prepared by Joan Blaeu for his Atlas Maior, published in the first book of the Atlas Van Loon (1664).
-
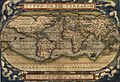
World map Theatrum Orbis Terrarum by Ortelius (1570).
-
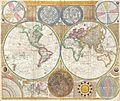
A general map of the world by Samuel Dunn, 1794, containing star chart, map of the Solar System, map of the Moon and other features along with Earth's both hemispheres.
-
A survey of Boston Harbor from Atlantic Neptune.
-
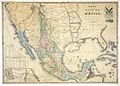
"Mapa de los Estados Unidos de Méjico by John Distrunell, the 1847 map used during the negotiations of the Treaty of Guadalupe Hidalgo ending the Mexican–American War.
-
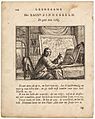
A portrait of a mapmaker looking up intently from his charts and holding a caliper, 1714.
-
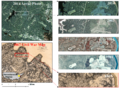
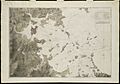
A US civil war hachure paper map made in 1867 by Cartographer Nathaniel Michler vs. modern aerial photos over Chancellorsville, Virginia.


See Also
 In Spanish: Historia de la cartografía para niños
- City maps
- Early world maps
- Forma Urbis Romae
- Geographic information system
- Great Trigonometrical Survey (India)
- Here be dragons
- History of Cartography Project
- Early modern Iberian (Spanish and Portuguese) cartography
- Early modern Netherlandish (Dutch and Flemish) cartography
- Cartography of India
- List of cartographers
- List of historical maps
- Map projection
- Mappa mundi
- Pictorial maps
- Principal Triangulation of Great Britain
- Terra incognita
- The Royal Thai Survey Department
- Web mapping
- World map
Related Histories
- History of geography
- History of geodesy
- History of navigation
- History of surveying
- History of cadastre
- History of topographic mapping
