
List of municipalities in Montana facts for kids

Montana is a large state located in the Western United States. It's known for its wide-open spaces! Even though Montana is the 4th largest state by land area, it has one of the smallest populations in the U.S., with about 1.08 million people living there as of 2020.
Montana is divided into 56 counties. Within these counties, there are 129 special areas called municipalities. These municipalities are basically the cities and towns where people live. While they only cover a small part of Montana's land, most of the state's population lives in these areas. The local governments in these cities and towns have important powers. They can create local laws, manage money, and even buy private land for public projects like roads or schools.
Contents
How Montana Classifies Its Cities and Towns
In Montana, cities and towns are put into different groups based on how many people live in them. This helps decide what kind of government they have.
Towns and Cities: What's the Difference?
- The smallest places are called towns.
- Larger places are called cities.
- A place can become a town if at least 300 people or two-thirds of its registered voters agree.
City Classes by Population
Cities are divided into three classes:
- Third Class City: These cities have between 1,000 and 5,000 people.
- Second Class City: These cities have between 5,000 and 10,000 people.
- First Class City: These are the largest cities, with more than 10,000 people.
Sometimes, if a city's population is close to the edge of a class (like between 9,000 and 10,000), they might get to choose if they want to be a First or Second Class city. The same goes for places between 5,000 and 7,500 people, or between 1,000 and 2,500 people.
Unincorporated Places
Some places in Montana are not officially cities or towns. These are called unincorporated places, like census-designated places. They are managed by the county government, not by their own city or town government.
Montana's Biggest and Smallest Places
The largest city in Montana by population is Billings, with 117,116 residents. On the other end, the smallest municipality is Ismay, with only 17 residents!
When it comes to land size, Anaconda is the largest municipality. It's a special type of city that's combined with its county, covering about 736.53 square miles. The smallest places by land area are Rexford and Flaxville, each covering only 0.10 square miles.
List of cities and towns
- Largest cities and towns in Montana by population
-
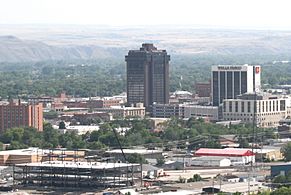
Downtown Billings, Montana's largest municipality by population
-
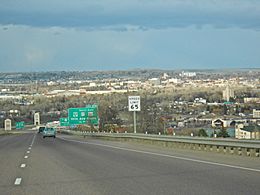
Missoula, Montana's second largest municipality by population
-
Great Falls, third largest municipality by population in Montana
-
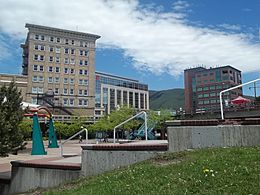
Downtown Bozeman, Montana's fourth largest municipality by population
-
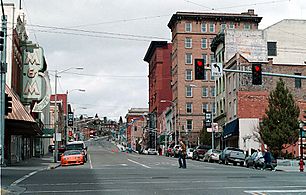
Uptown Butte, fifth largest municipality by population in Montana
-
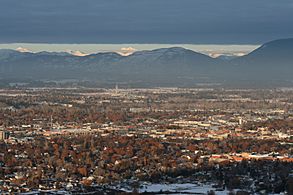
Kalispell, looking toward Glacier National Park
-
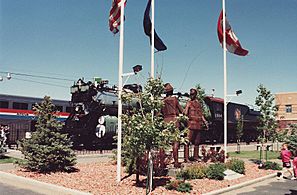
Havre railroad station and the sculpture "U.S. − Canada Friendship"
-
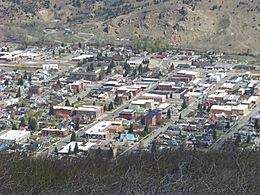
Downtown Anaconda, the largest city in Montana by land area
-
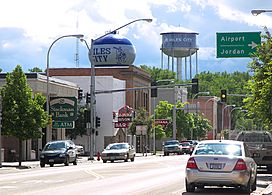
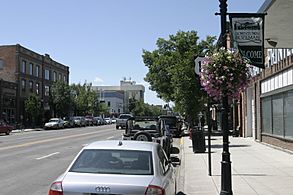
Downtown Miles City, Montana's eleventh largest municipality by population


County seat State capital and county seat
| Name | Type | County | Population (2020) |
Population (2010) |
Change | Land area (2010) |
Population density | |
|---|---|---|---|---|---|---|---|---|
| sq mi | km2 | |||||||
| Alberton | Town | Mineral | 452 | 420 | +7.6% | 0.57 | 1.5 | 793.0/sq mi (306.2/km2) |
| Anaconda |
Consolidated city-county | Deer Lodge | 9,421 | 9,298 | +1.3% | 736.53 | 1,907.6 | 12.8/sq mi (4.9/km2) |
| Bainville | Town | Roosevelt | 271 | 208 | +30.3% | 1.02 | 2.6 | 265.7/sq mi (102.6/km2) |
| Baker |
City | Fallon | 1,802 | 1,741 | +3.5% | 0.97 | 2.5 | 1,857.7/sq mi (717.3/km2) |
| Bearcreek | Town | Carbon | 91 | 79 | +15.2% | 0.12 | 0.31 | 758.3/sq mi (292.8/km2) |
| Belgrade | City | Gallatin | 10,460 | 7,389 | +41.6% | 3.25 | 8.4 | 3,218.5/sq mi (1,242.7/km2) |
| Belt | Town | Cascade | 510 | 597 | −14.6% | 0.35 | 0.91 | 1,457.1/sq mi (562.6/km2) |
| Big Sandy | Town | Chouteau | 605 | 598 | +1.2% | 0.44 | 1.1 | 1,375.0/sq mi (530.9/km2) |
| Big Timber |
City | Sweet Grass | 1,650 | 1,641 | +0.5% | 0.92 | 2.4 | 1,793.5/sq mi (692.5/km2) |
| Billings |
City | Yellowstone | 117,116 | 104,170 | +12.4% | 43.41 | 112.4 | 2,697.9/sq mi (1,041.7/km2) |
| Boulder |
Town | Jefferson | 1,201 | 1,183 | +1.5% | 1.13 | 2.9 | 1,062.8/sq mi (410.3/km2) |
| Bozeman |
City | Gallatin | 53,293 | 37,280 | +43.0% | 19.12 | 49.5 | 2,787.3/sq mi (1,076.2/km2) |
| Bridger | Town | Carbon | 662 | 708 | −6.5% | 0.80 | 2.1 | 827.5/sq mi (319.5/km2) |
| Broadus |
Town | Powder River | 456 | 468 | −2.6% | 0.34 | 0.88 | 1,341.2/sq mi (517.8/km2) |
| Broadview | Town | Yellowstone | 139 | 192 | −27.6% | 0.26 | 0.67 | 534.6/sq mi (206.4/km2) |
| Browning | Town | Glacier | 1,018 | 1,016 | +0.2% | 0.27 | 0.70 | 3,770.4/sq mi (1,455.8/km2) |
| Butte |
Consolidated city-county | Silver Bow | 34,494 | 33,525 | +2.9% | 716.25 | 1,855.1 | 48.2/sq mi (18.6/km2) |
| Cascade | Town | Cascade | 600 | 685 | −12.4% | 0.52 | 1.3 | 1,153.8/sq mi (445.5/km2) |
| Chester |
Town | Liberty | 847 | 847 | 0.0% | 0.48 | 1.2 | 1,764.6/sq mi (681.3/km2) |
| Chinook |
City | Blaine | 1,185 | 1,203 | −1.5% | 0.51 | 1.3 | 2,323.5/sq mi (897.1/km2) |
| Choteau |
City | Teton | 1,721 | 1,684 | +2.2% | 1.83 | 4.7 | 940.4/sq mi (363.1/km2) |
| Circle |
Town | McCone | 591 | 615 | −3.9% | 0.78 | 2.0 | 757.7/sq mi (292.5/km2) |
| Clyde Park | Town | Park | 332 | 288 | +15.3% | 0.32 | 0.83 | 1,037.5/sq mi (400.6/km2) |
| Colstrip | City | Rosebud | 2,096 | 2,214 | −5.3% | 4.47 | 11.6 | 468.9/sq mi (181.0/km2) |
| Columbia Falls | City | Flathead | 5,308 | 4,688 | +13.2% | 2.05 | 5.3 | 2,589.3/sq mi (999.7/km2) |
| Columbus |
Town | Stillwater | 1,857 | 1,893 | −1.9% | 1.32 | 3.4 | 1,406.8/sq mi (543.2/km2) |
| Conrad |
City | Pondera | 2,318 | 2,570 | −9.8% | 1.25 | 3.2 | 1,854.4/sq mi (716.0/km2) |
| Culbertson | Town | Roosevelt | 753 | 714 | +5.5% | 0.60 | 1.6 | 1,255.0/sq mi (484.6/km2) |
| Cut Bank |
City | Glacier | 3,056 | 2,869 | +6.5% | 0.99 | 2.6 | 3,086.9/sq mi (1,191.9/km2) |
| Darby | Town | Ravalli | 783 | 720 | +8.8% | 0.58 | 1.5 | 1,350.0/sq mi (521.2/km2) |
| Deer Lodge |
City | Powell | 2,938 | 3,111 | −5.6% | 1.44 | 3.7 | 2,040.3/sq mi (787.8/km2) |
| Denton | Town | Fergus | 205 | 255 | −19.6% | 0.76 | 2.0 | 269.7/sq mi (104.1/km2) |
| Dillon |
City | Beaverhead | 3,880 | 4,134 | −6.1% | 1.76 | 4.6 | 2,204.5/sq mi (851.2/km2) |
| Dodson | Town | Phillips | 125 | 124 | +0.8% | 0.19 | 0.49 | 657.9/sq mi (254.0/km2) |
| Drummond | Town | Granite | 272 | 309 | −12.0% | 0.53 | 1.4 | 513.2/sq mi (198.1/km2) |
| Dutton | Town | Teton | 303 | 316 | −4.1% | 0.31 | 0.80 | 977.4/sq mi (377.4/km2) |
| East Helena | City | Lewis and Clark | 1,944 | 1,984 | −2.0% | 1.73 | 4.5 | 1,123.7/sq mi (433.9/km2) |
| Ekalaka |
Town | Carter | 399 | 332 | +20.2% | 1.04 | 2.7 | 383.7/sq mi (148.1/km2) |
| Ennis | Town | Madison | 917 | 838 | +9.4% | 0.77 | 2.0 | 1,190.9/sq mi (459.8/km2) |
| Eureka | Town | Lincoln | 1,380 | 1,037 | +33.1% | 1.01 | 2.6 | 1,366.3/sq mi (527.5/km2) |
| Fairfield | Town | Teton | 759 | 708 | +7.2% | 0.31 | 0.80 | 2,448.4/sq mi (945.3/km2) |
| Fairview | Town | Richland | 896 | 840 | +6.7% | 0.97 | 2.5 | 923.7/sq mi (356.6/km2) |
| Flaxville | Town | Daniels | 63 | 71 | −11.3% | 0.10 | 0.26 | 630.0/sq mi (243.2/km2) |
| Forsyth |
City | Rosebud | 1,647 | 1,777 | −7.3% | 0.99 | 2.6 | 1,663.6/sq mi (642.3/km2) |
| Fort Benton |
City | Chouteau | 1,449 | 1,464 | −1.0% | 2.07 | 5.4 | 700.0/sq mi (270.3/km2) |
| Fort Peck | Town | Valley | 239 | 233 | +2.6% | 0.86 | 2.2 | 277.9/sq mi (107.3/km2) |
| Froid | Town | Roosevelt | 195 | 185 | +5.4% | 0.28 | 0.73 | 696.4/sq mi (268.9/km2) |
| Fromberg | Town | Carbon | 392 | 438 | −10.5% | 0.48 | 1.2 | 816.7/sq mi (315.3/km2) |
| Geraldine | Town | Chouteau | 207 | 261 | −20.7% | 0.52 | 1.3 | 398.1/sq mi (153.7/km2) |
| Glasgow |
City | Valley | 3,202 | 3,250 | −1.5% | 1.43 | 3.7 | 2,239.2/sq mi (864.6/km2) |
| Glendive |
City | Dawson | 4,873 | 4,935 | −1.3% | 3.32 | 8.6 | 1,467.8/sq mi (566.7/km2) |
| Grass Range | Town | Fergus | 110 | 110 | 0.0% | 0.15 | 0.39 | 733.3/sq mi (283.1/km2) |
| Great Falls |
City | Cascade | 60,442 | 58,505 | +3.3% | 21.79 | 56.4 | 2,773.8/sq mi (1,071.0/km2) |
| Hamilton |
City | Ravalli | 4,659 | 4,348 | +7.2% | 2.53 | 6.6 | 1,841.5/sq mi (711.0/km2) |
| Hardin |
City | Big Horn | 3,818 | 3,505 | +8.9% | 2.57 | 6.7 | 1,485.6/sq mi (573.6/km2) |
| Harlem | City | Blaine | 769 | 808 | −4.8% | 0.43 | 1.1 | 1,788.4/sq mi (690.5/km2) |
| Harlowton |
City | Wheatland | 955 | 997 | −4.2% | 0.58 | 1.5 | 1,646.6/sq mi (635.8/km2) |
| Havre |
City | Hill | 9,362 | 9,310 | +0.6% | 3.28 | 8.5 | 2,854.3/sq mi (1,102.1/km2) |
| Helena |
City | Lewis and Clark | 32,091 | 28,190 | +13.8% | 16.35 | 42.3 | 1,962.8/sq mi (757.8/km2) |
| Hingham | Town | Hill | 131 | 118 | +11.0% | 0.17 | 0.44 | 770.6/sq mi (297.5/km2) |
| Hobson | City | Judith Basin | 179 | 215 | −16.7% | 0.24 | 0.62 | 745.8/sq mi (288.0/km2) |
| Hot Springs | Town | Sanders | 557 | 544 | +2.4% | 0.38 | 0.98 | 1,465.8/sq mi (565.9/km2) |
| Hysham |
Town | Treasure | 276 | 312 | −11.5% | 0.21 | 0.54 | 1,314.3/sq mi (507.5/km2) |
| Ismay | Town | Custer | 17 | 19 | −10.5% | 0.42 | 1.1 | 40.5/sq mi (15.6/km2) |
| Joliet | Town | Carbon | 577 | 595 | −3.0% | 0.30 | 0.78 | 1,923.3/sq mi (742.6/km2) |
| Jordan |
Town | Garfield | 356 | 343 | +3.8% | 0.34 | 0.88 | 1,047.1/sq mi (404.3/km2) |
| Judith Gap | City | Wheatland | 110 | 126 | −12.7% | 0.38 | 0.98 | 289.5/sq mi (111.8/km2) |
| Kalispell |
City | Flathead | 24,558 | 19,927 | +23.2% | 11.64 | 30.1 | 1,711.9/sq mi (661.0/km2) |
| Kevin | Town | Toole | 154 | 154 | 0.0% | 0.34 | 0.88 | 452.9/sq mi (174.9/km2) |
| Laurel | City | Yellowstone | 7,222 | 6,718 | +7.5% | 2.14 | 5.5 | 3,374.8/sq mi (1,303.0/km2) |
| Lavina | Town | Golden Valley | 136 | 187 | −27.3% | 1.00 | 2.6 | 136.0/sq mi (52.5/km2) |
| Lewistown |
City | Fergus | 5,952 | 5,901 | +0.9% | 5.32 | 13.8 | 1,118.8/sq mi (432.0/km2) |
| Libby |
City | Lincoln | 2,775 | 2,628 | +5.6% | 1.91 | 4.9 | 1,452.9/sq mi (561.0/km2) |
| Lima | Town | Beaverhead | 212 | 221 | −4.1% | 0.53 | 1.4 | 400.0/sq mi (154.4/km2) |
| Livingston |
City | Park | 8,040 | 7,044 | +14.1% | 6.02 | 15.6 | 1,335.5/sq mi (515.6/km2) |
| Lodge Grass | Town | Big Horn | 441 | 428 | +3.0% | 0.24 | 0.62 | 1,837.5/sq mi (709.5/km2) |
| Malta |
City | Phillips | 1,860 | 1,997 | −6.9% | 1.06 | 2.7 | 1,754.7/sq mi (677.5/km2) |
| Manhattan | Town | Gallatin | 2,086 | 1,520 | +37.2% | 1.93 | 5.0 | 1,080.8/sq mi (417.3/km2) |
| Medicine Lake | Town | Sheridan | 244 | 225 | +8.4% | 0.40 | 1.0 | 610.0/sq mi (235.5/km2) |
| Melstone | Town | Musselshell | 126 | 96 | +31.3% | 0.69 | 1.8 | 182.6/sq mi (70.5/km2) |
| Miles City |
City | Custer | 8,354 | 8,410 | −0.7% | 3.34 | 8.7 | 2,501.2/sq mi (965.7/km2) |
| Missoula |
City | Missoula | 73,489 | 66,788 | +10.0% | 27.51 | 71.3 | 2,671.4/sq mi (1,031.4/km2) |
| Moore | Town | Fergus | 194 | 193 | +0.5% | 0.24 | 0.62 | 808.3/sq mi (312.1/km2) |
| Nashua | Town | Valley | 301 | 290 | +3.8% | 0.66 | 1.7 | 456.1/sq mi (176.1/km2) |
| Neihart | Town | Cascade | 43 | 51 | −15.7% | 1.99 | 5.2 | 21.6/sq mi (8.3/km2) |
| Opheim | Town | Valley | 75 | 85 | −11.8% | 0.21 | 0.54 | 357.1/sq mi (137.9/km2) |
| Outlook | Town | Sheridan | 84 | 47 | +78.7% | 1.30 | 3.4 | 64.6/sq mi (24.9/km2) |
| Philipsburg |
Town | Granite | 841 | 820 | +2.6% | 0.80 | 2.1 | 1,051.3/sq mi (405.9/km2) |
| Pinesdale | Town | Ravalli | 805 | 917 | −12.2% | 1.29 | 3.3 | 624.0/sq mi (240.9/km2) |
| Plains | Town | Sanders | 1,106 | 1,048 | +5.5% | 0.59 | 1.5 | 1,874.6/sq mi (723.8/km2) |
| Plentywood |
City | Sheridan | 1,669 | 1,734 | −3.7% | 1.17 | 3.0 | 1,426.5/sq mi (550.8/km2) |
| Plevna | Town | Fallon | 179 | 162 | +10.5% | 0.59 | 1.5 | 303.4/sq mi (117.1/km2) |
| Polson |
City | Lake | 5,148 | 4,488 | +14.7% | 4.14 | 10.7 | 1,243.5/sq mi (480.1/km2) |
| Poplar | City | Roosevelt | 758 | 810 | −6.4% | 0.28 | 0.73 | 2,707.1/sq mi (1,045.2/km2) |
| Red Lodge |
City | Carbon | 2,257 | 2,125 | +6.2% | 2.80 | 7.3 | 806.1/sq mi (311.2/km2) |
| Rexford | Town | Lincoln | 78 | 105 | −25.7% | 0.10 | 0.26 | 780.0/sq mi (301.2/km2) |
| Richey | Town | Dawson | 164 | 177 | −7.3% | 0.24 | 0.62 | 683.3/sq mi (263.8/km2) |
| Ronan | City | Lake | 1,955 | 1,871 | +4.5% | 1.19 | 3.1 | 1,642.9/sq mi (634.3/km2) |
| Roundup |
City | Musselshell | 1,742 | 1,788 | −2.6% | 1.34 | 3.5 | 1,300.0/sq mi (501.9/km2) |
| Ryegate |
Town | Golden Valley | 223 | 245 | −9.0% | 0.69 | 1.8 | 323.2/sq mi (124.8/km2) |
| Saco | Town | Phillips | 159 | 197 | −19.3% | 0.33 | 0.85 | 481.8/sq mi (186.0/km2) |
| Scobey |
City | Daniels | 999 | 1,017 | −1.8% | 0.76 | 2.0 | 1,314.5/sq mi (507.5/km2) |
| Shelby |
City | Toole | 3,169 | 3,376 | −6.1% | 6.03 | 15.6 | 525.5/sq mi (202.9/km2) |
| Sheridan | Town | Madison | 694 | 642 | +8.1% | 1.02 | 2.6 | 680.4/sq mi (262.7/km2) |
| Sidney |
City | Richland | 6,346 | 5,191 | +22.3% | 2.66 | 6.9 | 2,385.7/sq mi (921.1/km2) |
| St. Ignatius | Town | Lake | 768 | 842 | −8.8% | 0.56 | 1.5 | 1,371.4/sq mi (529.5/km2) |
| Stanford |
Town | Judith Basin | 403 | 401 | +0.5% | 0.44 | 1.1 | 915.9/sq mi (353.6/km2) |
| Stevensville | Town | Ravalli | 2,002 | 1,809 | +10.7% | 0.98 | 2.5 | 2,042.9/sq mi (788.8/km2) |
| Sunburst | Town | Toole | 333 | 375 | −11.2% | 0.24 | 0.62 | 1,387.5/sq mi (535.7/km2) |
| Superior |
Town | Mineral | 830 | 812 | +2.2% | 1.04 | 2.7 | 798.1/sq mi (308.1/km2) |
| Terry |
Town | Prairie | 562 | 605 | −7.1% | 0.71 | 1.8 | 791.5/sq mi (305.6/km2) |
| Thompson Falls |
City | Sanders | 1,336 | 1,313 | +1.8% | 1.73 | 4.5 | 772.3/sq mi (298.2/km2) |
| Three Forks | City | Gallatin | 1,989 | 1,869 | +6.4% | 1.44 | 3.7 | 1,381.3/sq mi (533.3/km2) |
| Townsend |
City | Broadwater | 1,787 | 1,878 | −4.8% | 1.58 | 4.1 | 1,131.0/sq mi (436.7/km2) |
| Troy | City | Lincoln | 797 | 938 | −15.0% | 0.76 | 2.0 | 1,048.7/sq mi (404.9/km2) |
| Twin Bridges | Town | Madison | 330 | 375 | −12.0% | 0.96 | 2.5 | 343.8/sq mi (132.7/km2) |
| Valier | Town | Pondera | 530 | 509 | +4.1% | 0.92 | 2.4 | 576.1/sq mi (222.4/km2) |
| Virginia City |
Town | Madison | 219 | 190 | +15.3% | 0.95 | 2.5 | 230.5/sq mi (89.0/km2) |
| Walkerville | Town | Silver Bow | 639 | 675 | −5.3% | 2.23 | 5.8 | 286.5/sq mi (110.6/km2) |
| West Yellowstone | Town | Gallatin | 1,272 | 1,271 | +0.1% | 0.80 | 2.1 | 1,590.0/sq mi (613.9/km2) |
| Westby | Town | Sheridan | 167 | 168 | −0.6% | 0.54 | 1.4 | 309.3/sq mi (119.4/km2) |
| White Sulphur Springs |
City | Meagher | 955 | 939 | +1.7% | 1.01 | 2.6 | 945.5/sq mi (365.1/km2) |
| Whitefish | City | Flathead | 7,751 | 6,357 | +21.9% | 6.43 | 16.7 | 1,205.4/sq mi (465.4/km2) |
| Whitehall | Town | Jefferson | 1,006 | 1,038 | −3.1% | 0.67 | 1.7 | 1,501.5/sq mi (579.7/km2) |
| Wibaux |
Town | Wibaux | 462 | 589 | −21.6% | 1.08 | 2.8 | 427.8/sq mi (165.2/km2) |
| Winifred | Town | Fergus | 172 | 208 | −17.3% | 0.50 | 1.3 | 344.0/sq mi (132.8/km2) |
| Winnett |
Town | Petroleum | 188 | 182 | +3.3% | 0.98 | 2.5 | 191.8/sq mi (74.1/km2) |
| Wolf Point |
City | Roosevelt | 2,517 | 2,621 | −4.0% | 0.87 | 2.3 | 2,893.1/sq mi (1,117.0/km2) |
| Total towns | 76 | — | 38,130 | 37,333 | +2.1% | 49.01 | 126.9 | 778.0/sq mi (300.4/km2) |
| Total cities | 53 | — | 549,663 | 494,659 | +11.1% | 1,685.57 | 4,365.6 | 326.1/sq mi (125.9/km2) |
| Total | 129 | — | 587,793 | 531,992 | +10.5% | 1,734.58 | 4,492.5 | 338.9/sq mi (130.9/km2) |
See also
 In Spanish: Anexo:Localidades de Montana para niños
- List of counties in Montana
- List of ghost towns in Montana
- List of places in Montana
