Greater Boston facts for kids
Quick facts for kids
Greater Boston
|
|
|---|---|
|
Combined Statistical Area
|
|
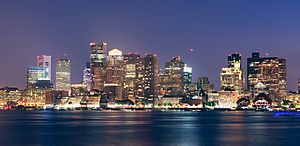
Boston in July 2015
|
|
| Country | |
| State | |
| Principal cities | |
| Population
(2020)
|
|
| • Total | 8,466,186 (CSA) 4,941,632 (MSA) |
| • Rank |
|
| GDP | |
| • Boston (MSA) | $571.7 billion (2022) |
| Time zone | UTC−5 (EST) |
| • Summer (DST) | UTC−4 (EDT) |
| Area code(s) | 617, 781, 857, 339, 978, 508, 351, 774, 603, 401 |
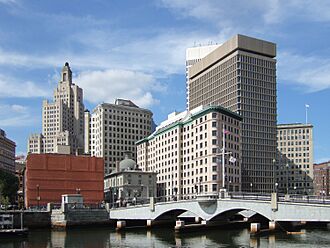
Greater Boston is a large area in New England. It includes the city of Boston, which is the capital of Massachusetts. Boston is also the biggest city in New England. Greater Boston also covers many towns and cities around Boston.
The city of Boston is about 48 square miles. It had 675,647 people in 2020. But the whole Greater Boston area is much larger. It includes places like Providence, Rhode Island, Manchester, New Hampshire, and Worcester. More than 8.4 million people live in this wider area. This makes it one of the largest regions in the U.S.
Greater Boston is famous for its many colleges, universities, and hospitals. It has played a big role in American history and business. The region is a world leader in areas like biotechnology (making new medicines), artificial intelligence (AI), and engineering. It is also strong in finance and maritime trade (shipping).
Greater Boston is the 10th largest metropolitan area in the U.S. for population. It is the 6th largest when looking at combined statistical areas. Many important people and historical events in American culture happened here. This includes famous writers, politicians, and events from the American Revolution.
Plymouth was where the first colony in New England started in 1620. The Pilgrims arrived there on the Mayflower. Later, in 1692, the town of Salem had the famous Salem witch trials. In the late 1700s, Boston was called the "Cradle of Liberty." This was because of the important actions there that led to the American Revolution.
The Greater Boston region has been very important in science, business, and culture in the U.S. Before the American Civil War, it was a center for movements against slavery and for other social changes. Many famous American political families, like the Adams and Kennedy families, came from this area.
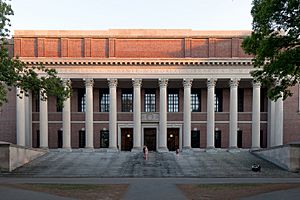
Harvard University in Cambridge is the oldest university in the U.S. It has a very large financial fund. Its Law School has trained many Justices. Kendall Square in Cambridge is known as "the most innovative square mile on the planet." This is because many new companies and ideas have started there since 2010. Both Harvard and the Massachusetts Institute of Technology (MIT) are among the top universities in the world.
Contents
Exploring the Geography of Greater Boston
What Defines the Greater Boston Area?
There are different ways to define the Greater Boston area. These definitions help with planning for things like transportation and economic growth.
The Metropolitan Area Planning Council (MAPC) Definition
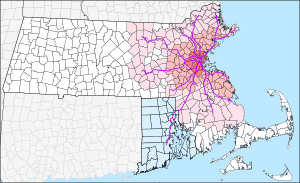
The MAPC uses a strict definition for Greater Boston. This area includes 101 cities and towns. They are grouped into eight smaller regions. This area covers most of the land inside the I-495 highway. In 2013, about 3.2 million people lived in the MAPC district. This was almost half of Massachusetts' total population. The area is about 1,422 square miles. A lot of it is covered by forests, water, or open spaces.
The cities and towns in this definition are:
- Acton
- Arlington
- Ashland
- Bedford
- Bellingham
- Belmont
- Beverly
- Bolton
- Boston
- Boxborough
- Braintree
- Brookline
- Burlington
- Cambridge
- Canton
- Carlisle
- Chelsea
- Cohasset
- Concord
- Danvers
- Dedham
- Dover
- Duxbury
- Essex
- Everett
- Foxborough
- Framingham
- Franklin
- Gloucester
- Hamilton
- Hanover
- Hingham
- Holbrook
- Holliston
- Hopkinton
- Hudson
- Hull
- Ipswich
- Lexington
- Lincoln
- Littleton
- Lynn
- Lynnfield
- Malden
- Manchester-by-the-Sea
- Marblehead
- Marlborough
- Marshfield
- Maynard
- Medfield
- Medford
- Medway
- Melrose
- Middleton
- Milford
- Millis
- Milton
- Nahant
- Natick
- Needham
- Newton
- Norfolk
- North Reading
- Norwell
- Norwood
- Peabody
- Pembroke
- Quincy
- Randolph
- Reading
- Revere
- Rockland
- Rockport
- Salem
- Saugus
- Scituate
- Sharon
- Sherborn
- Somerville
- Southborough
- Stoneham
- Stoughton
- Stow
- Sudbury
- Swampscott
- Topsfield
- Wakefield
- Walpole
- Waltham
- Watertown
- Wayland
- Wellesley
- Wenham
- Weston
- Westwood
- Weymouth
- Wilmington
- Winchester
- Winthrop
- Woburn
- Wrentham
U.S. Census Bureau Definitions
The United States Census uses two main ways to define the Boston area. One is the Boston–Cambridge–Newton, MA–NH Metro Area. This one is based on counties. The other is the Boston–Cambridge–Newton, MA–NH Metropolitan NECTA. This one uses city and town borders.
The counties in the county-based definition are:
- Essex County, Massachusetts
- Middlesex County, Massachusetts
- Norfolk County, Massachusetts
- Plymouth County, Massachusetts
- Suffolk County, Massachusetts
- Rockingham County, New Hampshire
- Strafford County, New Hampshire
The NECTA definition includes all the towns from the MAPC definition. It also adds communities from the Merrimack Valley and parts of southern New Hampshire. This includes areas like Milford and Hampton. It also includes the Taunton area.
| Historical population | |||
|---|---|---|---|
| Census | Pop. | %± | |
| 1850 | 650,357 | — | |
| 1860 | 830,998 | 27.8% | |
| 1870 | 978,346 | 17.7% | |
| 1880 | 1,205,439 | 23.2% | |
| 1890 | 1,515,684 | 25.7% | |
| 1900 | 1,890,122 | 24.7% | |
| 1910 | 2,260,762 | 19.6% | |
| 1920 | 2,563,123 | 13.4% | |
| 1930 | 2,866,567 | 11.8% | |
| 1940 | 2,926,650 | 2.1% | |
| 1950 | 3,186,970 | 8.9% | |
| 1960 | 3,516,435 | 10.3% | |
| 1970 | 3,918,092 | 11.4% | |
| 1980 | 3,938,585 | 0.5% | |
| 1990 | 4,133,895 | 5.0% | |
| 2000 | 4,391,344 | 6.2% | |
| 2010 | 4,552,402 | 3.7% | |
| 2020 | 4,941,632 | 8.5% | |
| 2022 (est.) | 4,900,550 | 7.6% | |
| US Decennial Census | |||
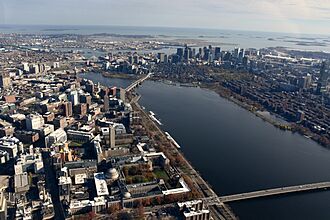
The Combined Statistical Area (CSA) Definition
The broadest definition is the Boston–Worcester–Providence combined statistical area. This area is based on where people travel for work. It includes counties in Connecticut, Massachusetts, Rhode Island, and New Hampshire.
The counties in this large area are:
- Connecticut
- Massachusetts
- New Hampshire
- Rhode Island
In 2020, the total population for this wide region was about 8,466,186 people.
Smaller Regions within Greater Boston
Greater Boston is made up of many smaller regions. These include:
- Massachusetts
- New Hampshire
- Lakes Region
- Seacoast
- Rhode Island
- Blackstone Valley
- East Bay
What is the Climate Like?
The Boston area has a humid continental climate. This means it has all four seasons with warm summers and cold winters. There is also a lot of humidity and precipitation (rain and snow) throughout the year.
| Climate data for Concord Municipal Airport, New Hampshire (1981−2010 normals, extremes 1903–present) | |||||||||||||
|---|---|---|---|---|---|---|---|---|---|---|---|---|---|
| Month | Jan | Feb | Mar | Apr | May | Jun | Jul | Aug | Sep | Oct | Nov | Dec | Year |
| Record high °F (°C) | 69 (21) |
67 (19) |
89 (32) |
95 (35) |
98 (37) |
101 (38) |
102 (39) |
101 (38) |
98 (37) |
90 (32) |
80 (27) |
73 (23) |
102 (39) |
| Mean maximum °F (°C) | 50.8 (10.4) |
53.7 (12.1) |
66.6 (19.2) |
81.5 (27.5) |
88.7 (31.5) |
92.0 (33.3) |
93.1 (33.9) |
91.8 (33.2) |
87.7 (30.9) |
78.5 (25.8) |
68.7 (20.4) |
56.0 (13.3) |
95.5 (35.3) |
| Mean daily maximum °F (°C) | 30.8 (−0.7) |
34.9 (1.6) |
43.8 (6.6) |
57.4 (14.1) |
68.9 (20.5) |
77.4 (25.2) |
82.3 (27.9) |
80.9 (27.2) |
72.6 (22.6) |
60.5 (15.8) |
48.4 (9.1) |
36.3 (2.4) |
58.0 (14.4) |
| Mean daily minimum °F (°C) | 10.4 (−12.0) |
13.8 (−10.1) |
22.5 (−5.3) |
32.7 (0.4) |
42.6 (5.9) |
52.5 (11.4) |
57.7 (14.3) |
56.1 (13.4) |
47.4 (8.6) |
35.8 (2.1) |
28.2 (−2.1) |
17.2 (−8.2) |
34.8 (1.6) |
| Mean minimum °F (°C) | −11.2 (−24.0) |
−8.2 (−22.3) |
0.8 (−17.3) |
19.4 (−7.0) |
28.1 (−2.2) |
37.9 (3.3) |
45.4 (7.4) |
42.0 (5.6) |
31.8 (−0.1) |
21.2 (−6.0) |
11.1 (−11.6) |
−2.8 (−19.3) |
−14.6 (−25.9) |
| Record low °F (°C) | −33 (−36) |
−37 (−38) |
−16 (−27) |
4 (−16) |
21 (−6) |
30 (−1) |
35 (2) |
29 (−2) |
20 (−7) |
10 (−12) |
−5 (−21) |
−22 (−30) |
−37 (−38) |
| Average precipitation inches (mm) | 2.70 (69) |
2.62 (67) |
3.27 (83) |
3.41 (87) |
3.66 (93) |
3.69 (94) |
3.74 (95) |
3.18 (81) |
3.38 (86) |
4.04 (103) |
3.72 (94) |
3.20 (81) |
40.61 (1,033) |
| Average snowfall inches (cm) | 18.1 (46) |
12.3 (31) |
11.1 (28) |
2.8 (7.1) |
0 (0) |
0 (0) |
0 (0) |
0 (0) |
0 (0) |
trace | 2.6 (6.6) |
14.5 (37) |
61.4 (156) |
| Average precipitation days (≥ 0.01 in) | 10.8 | 9.5 | 11.5 | 11.8 | 12.4 | 12.7 | 10.9 | 9.8 | 9.3 | 10.1 | 11.2 | 10.9 | 130.9 |
| Average snowy days (≥ 0.1 in) | 8.2 | 6.5 | 5.3 | 1.2 | 0 | 0 | 0 | 0 | 0 | 0 | 1.9 | 6.6 | 29.7 |
| Average relative humidity (%) | 67.9 | 66.0 | 64.8 | 62.0 | 65.0 | 70.9 | 71.8 | 74.5 | 76.3 | 72.8 | 73.3 | 72.3 | 69.8 |
| Mean monthly sunshine hours | 162.8 | 171.8 | 210.5 | 223.2 | 258.4 | 274.3 | 295.8 | 261.9 | 214.7 | 183.4 | 127.8 | 134.8 | 2,519.4 |
| Percent possible sunshine | 56 | 58 | 57 | 56 | 57 | 60 | 64 | 61 | 57 | 54 | 44 | 48 | 56 |
| Source: NOAA (relative humidity and sun 1961–1990) | |||||||||||||
| Climate data for Boston (Logan Airport), 1981−2010 normals, extremes 1872−present | |||||||||||||
|---|---|---|---|---|---|---|---|---|---|---|---|---|---|
| Month | Jan | Feb | Mar | Apr | May | Jun | Jul | Aug | Sep | Oct | Nov | Dec | Year |
| Record high °F (°C) | 72 (22) |
73 (23) |
89 (32) |
94 (34) |
97 (36) |
100 (38) |
104 (40) |
102 (39) |
102 (39) |
90 (32) |
83 (28) |
76 (24) |
104 (40) |
| Mean maximum °F (°C) | 56.4 (13.6) |
57.7 (14.3) |
67.6 (19.8) |
80.7 (27.1) |
87.3 (30.7) |
92.1 (33.4) |
94.9 (34.9) |
93.3 (34.1) |
87.9 (31.1) |
79.1 (26.2) |
70.5 (21.4) |
61.3 (16.3) |
96.2 (35.7) |
| Mean daily maximum °F (°C) | 35.8 (2.1) |
38.7 (3.7) |
45.4 (7.4) |
55.6 (13.1) |
66.0 (18.9) |
75.9 (24.4) |
81.4 (27.4) |
79.6 (26.4) |
72.4 (22.4) |
61.4 (16.3) |
51.5 (10.8) |
41.2 (5.1) |
58.8 (14.9) |
| Mean daily minimum °F (°C) | 22.2 (−5.4) |
24.7 (−4.1) |
31.1 (−0.5) |
40.6 (4.8) |
49.9 (9.9) |
59.5 (15.3) |
65.4 (18.6) |
64.6 (18.1) |
57.4 (14.1) |
46.5 (8.1) |
38.0 (3.3) |
28.2 (−2.1) |
44.1 (6.7) |
| Mean minimum °F (°C) | 4.1 (−15.5) |
8.5 (−13.1) |
14.7 (−9.6) |
30.7 (−0.7) |
40.8 (4.9) |
49.6 (9.8) |
57.3 (14.1) |
55.4 (13.0) |
45.8 (7.7) |
34.9 (1.6) |
24.2 (−4.3) |
11.1 (−11.6) |
2.3 (−16.5) |
| Record low °F (°C) | −13 (−25) |
−18 (−28) |
−8 (−22) |
11 (−12) |
31 (−1) |
41 (5) |
50 (10) |
46 (8) |
34 (1) |
25 (−4) |
−2 (−19) |
−17 (−27) |
−18 (−28) |
| Average precipitation inches (mm) | 3.36 (85) |
3.25 (83) |
4.32 (110) |
3.74 (95) |
3.49 (89) |
3.68 (93) |
3.43 (87) |
3.35 (85) |
3.44 (87) |
3.94 (100) |
3.99 (101) |
3.78 (96) |
43.77 (1,112) |
| Average snowfall inches (cm) | 12.9 (33) |
10.9 (28) |
7.8 (20) |
1.9 (4.8) |
0 (0) |
0 (0) |
0 (0) |
0 (0) |
0 (0) |
trace | 1.3 (3.3) |
9.0 (23) |
43.8 (111) |
| Average precipitation days (≥ 0.01 in) | 11.3 | 9.8 | 11.6 | 11.2 | 12.0 | 10.9 | 9.6 | 9.4 | 8.6 | 9.4 | 10.6 | 11.6 | 126.0 |
| Average snowy days (≥ 0.1 in) | 6.7 | 5.3 | 4.2 | 0.7 | 0 | 0 | 0 | 0 | 0 | 0.1 | 0.8 | 4.6 | 22.4 |
| Average relative humidity (%) | 62.3 | 62.0 | 63.1 | 63.0 | 66.7 | 68.5 | 68.4 | 70.8 | 71.8 | 68.5 | 67.5 | 65.4 | 66.5 |
| Mean monthly sunshine hours | 163.4 | 168.4 | 213.7 | 227.2 | 267.3 | 286.5 | 300.9 | 277.3 | 237.1 | 206.3 | 143.2 | 142.3 | 2,633.6 |
| Percent possible sunshine | 56 | 57 | 58 | 57 | 59 | 63 | 65 | 64 | 63 | 60 | 49 | 50 | 59 |
| Source: NOAA (relative humidity and sun 1961−1990) | |||||||||||||
| Climate data for Providence, Rhode Island (T. F. Green Airport), 1981–2010 normals, extremes 1904–present | |||||||||||||
|---|---|---|---|---|---|---|---|---|---|---|---|---|---|
| Month | Jan | Feb | Mar | Apr | May | Jun | Jul | Aug | Sep | Oct | Nov | Dec | Year |
| Record high °F (°C) | 69 (21) |
72 (22) |
90 (32) |
98 (37) |
96 (36) |
98 (37) |
102 (39) |
104 (40) |
100 (38) |
88 (31) |
81 (27) |
77 (25) |
104 (40) |
| Mean maximum °F (°C) | 57.2 (14.0) |
58.3 (14.6) |
68.4 (20.2) |
80.3 (26.8) |
86.2 (30.1) |
91.3 (32.9) |
94.5 (34.7) |
92.3 (33.5) |
87.0 (30.6) |
78.1 (25.6) |
70.0 (21.1) |
60.8 (16.0) |
96.2 (35.7) |
| Mean daily maximum °F (°C) | 37.4 (3.0) |
40.3 (4.6) |
47.8 (8.8) |
58.6 (14.8) |
68.4 (20.2) |
77.5 (25.3) |
82.8 (28.2) |
81.4 (27.4) |
74.2 (23.4) |
63.3 (17.4) |
53.2 (11.8) |
42.3 (5.7) |
60.6 (15.9) |
| Mean daily minimum °F (°C) | 21.0 (−6.1) |
23.6 (−4.7) |
30.0 (−1.1) |
39.6 (4.2) |
48.6 (9.2) |
58.4 (14.7) |
64.2 (17.9) |
63.2 (17.3) |
55.3 (12.9) |
43.9 (6.6) |
35.7 (2.1) |
26.3 (−3.2) |
42.5 (5.8) |
| Mean minimum °F (°C) | 2.9 (−16.2) |
7.7 (−13.5) |
14.7 (−9.6) |
28.8 (−1.8) |
36.9 (2.7) |
47.1 (8.4) |
55.0 (12.8) |
52.4 (11.3) |
42.2 (5.7) |
31.2 (−0.4) |
21.7 (−5.7) |
10.4 (−12.0) |
0.9 (−17.3) |
| Record low °F (°C) | −13 (−25) |
−17 (−27) |
1 (−17) |
11 (−12) |
29 (−2) |
39 (4) |
48 (9) |
40 (4) |
32 (0) |
20 (−7) |
6 (−14) |
−12 (−24) |
−17 (−27) |
| Average precipitation inches (mm) | 3.86 (98) |
3.29 (84) |
5.01 (127) |
4.36 (111) |
3.55 (90) |
3.64 (92) |
3.29 (84) |
3.60 (91) |
3.92 (100) |
3.93 (100) |
4.51 (115) |
4.22 (107) |
47.18 (1,198) |
| Average snowfall inches (cm) | 9.0 (23) |
8.5 (22) |
5.5 (14) |
0.6 (1.5) |
0 (0) |
0 (0) |
0 (0) |
0 (0) |
0 (0) |
0 (0) |
1.5 (3.8) |
8.7 (22) |
33.8 (86) |
| Average precipitation days (≥ 0.01 in) | 10.9 | 9.7 | 11.9 | 11.3 | 12.0 | 10.9 | 9.4 | 9.0 | 8.7 | 9.4 | 10.1 | 11.6 | 124.9 |
| Average snowy days (≥ 0.1 in) | 5.7 | 4.6 | 3.5 | 0.4 | 0 | 0 | 0 | 0 | 0 | 0 | 0.6 | 3.9 | 18.7 |
| Average relative humidity (%) | 63.9 | 63.0 | 62.9 | 61.4 | 66.6 | 70.1 | 71.0 | 72.5 | 73.0 | 70.2 | 68.9 | 67.0 | 67.5 |
| Mean monthly sunshine hours | 171.7 | 172.6 | 215.6 | 225.1 | 254.9 | 274.1 | 290.6 | 262.8 | 233.0 | 208.7 | 148.0 | 148.6 | 2,605.7 |
| Percent possible sunshine | 58 | 58 | 58 | 56 | 57 | 60 | 63 | 61 | 62 | 61 | 50 | 52 | 58 |
| Source: NOAA (relative humidity and sun 1961–1990), The Weather Channel | |||||||||||||
People and Cultures of Greater Boston
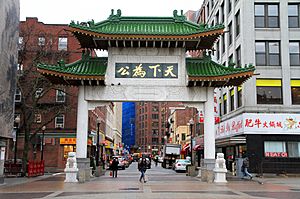
Greater Boston has a large Jewish community. It is estimated that 5–6% of the population identifies as Jewish. This is higher than the national average. The number of Jewish people in Greater Boston is growing. This is partly because many children in mixed-faith families are raised Jewish.
The city of Boston also has one of the largest populations of people who identify as LGBT. It ranks fifth among major U.S. cities for this group.
Population by County
Here is a table showing the population in some counties within Greater Boston:
| County | 2021 Estimate | 2020 Census | Change | Area | Density |
|---|---|---|---|---|---|
| Middlesex County, Massachusetts | 1,614,742 | 1,632,002 | −1.06% | 817.82 sq mi (2,118.1 km2) | 1,974/sq mi (762/km2) |
| Essex County, Massachusetts | 807,074 | 809,829 | −0.34% | 492.56 sq mi (1,275.7 km2) | 1,639/sq mi (633/km2) |
| Suffolk County, Massachusetts | 771,245 | 797,936 | −3.35% | 58.15 sq mi (150.6 km2) | 13,263/sq mi (5,121/km2) |
| Norfolk County, Massachusetts | 724,505 | 725,981 | −0.20% | 396.11 sq mi (1,025.9 km2) | 1,829/sq mi (706/km2) |
| Plymouth County, Massachusetts | 533,003 | 530,819 | +0.41% | 659.07 sq mi (1,707.0 km2) | 809/sq mi (312/km2) |
| Rockingham County, New Hampshire | 316,947 | 314,176 | +0.88% | 694.72 sq mi (1,799.3 km2) | 456/sq mi (176/km2) |
| Strafford County, New Hampshire | 132,416 | 130,889 | +1.17% | 368.97 sq mi (955.6 km2) | 359/sq mi (139/km2) |
| Total | 4,899,932 | 4,941,642 | −0.84% | 3,487.40 sq mi (9,032.3 km2) | 1,405/sq mi (542/km2) |
Most Diverse Areas
The following table shows some of the most diverse areas in Greater Boston. This means they have a mix of different racial and ethnic groups.
| Rank | City or neighborhood | Census tract | Population | % White | % Black | % Hispanic | % Asian | % multiracial or other |
|---|---|---|---|---|---|---|---|---|
| 1 | Dorchester | 916 | 3,138 | 12 | 32 | 15 | 26 | 14 |
| 2 | Pawtucket | 161 | 4,607 | 28 | 24 | 28 | 1 | 18 |
| 3 | Pawtucket | 151 | 4,472 | 24 | 24 | 29 | 1 | 23 |
| 4 | Pawtucket | 164 | 4,938 | 29 | 26 | 21 | 2 | 20 |
| 5 | Dorchester | 912 | 3,234 | 30 | 24 | 22 | 6 | 18 |
| 6 | Dorchester | 92101 | 6,451 | 30 | 22 | 11 | 31 | 6 |
| 7 | Brockton | 5115 | 4,308 | 21 | 32 | 13 | 2 | 32 |
| 8 | Brockton | 511 | 3,040 | 28 | 33 | 15 | 1 | 24 |
| 9 | New Bedford | 6519 | 1,942 | 26 | 11 | 33 | 1 | 29 |
| 10 | Mission Hill | 80801 | 3,885 | 32 | 20 | 35 | 10 | 2 |
| 11 | Pawtucket | 154 | 2,258 | 35 | 20 | 35 | 0 | 11 |
| 12 | Brockton | 5114 | 3,716 | 24 | 36 | 14 | 2 | 23 |
| 13 | Brockton | 5109 | 2,531 | 24 | 36 | 16 | 1 | 24 |
| 14 | Brockton | 5103 | 3,798 | 23 | 38 | 15 | 2 | 24 |
| 15 | Brockton | 5104 | 3,706 | 19 | 38 | 15 | 2 | 25 |
| 16 | Dorchester | 90901 | 3,730 | 38 | 18 | 21 | 20 | 4 |
| 17 | Worcester | 733 | 3,762 | 38 | 10 | 37 | 12 | 4 |
| 18 | Providence | 26 | 3,098 | 23 | 22 | 39 | 10 | 6 |
| 19 | Malden | 3415 | 4,780 | 39 | 23 | 14 | 19 | 5 |
| 20 | Cambridge | 3524 | 2,126 | 27 | 39 | 16 | 12 | 5 |
| 21 | South End | 71202 | 3,131 | 39 | 19 | 24 | 15 | 3 |
| 22 | Brockton | 511301 | 5,334 | 39 | 31 | 11 | 2 | 17 |
| 23 | Providence | 15 | 2,994 | 28 | 13 | 41 | 14 | 4 |
| 24 | South Boston | 61 | 3,098 | 41 | 15 | 29 | 11 | 4 |
| 25 | Lynn | 2072 | 2,939 | 30 | 12 | 42 | 13 | 2 |
| 26 | Cambridge | 3549 | 6,058 | 35 | 30 | 9 | 20 | 5 |
| 27 | South Boston | 61101 | 2,232 | 20 | 21 | 42 | 14 | 2 |
| 28 | Brockton | 5116 | 7,211 | 42 | 29 | 10 | 2 | 16 |
| 29 | Roxbury | 801 | 3,350 | 15 | 43 | 28 | 1 | 11 |
| 30 | Lowell | 3114 | 5,986 | 44 | 11 | 14 | 26 | 5 |
| 31 | Brockton | 5108 | 6,339 | 18 | 44 | 12 | 2 | 22 |
| 32 | Mission Hill | 81001 | 4,890 | 45 | 14 | 19 | 19 | 2 |
| 33 | Malden | 3418 | 6,554 | 46 | 20 | 13 | 16 | 5 |
| 34 | South Boston | 607 | 1,893 | 19 | 20 | 46 | 10 | 5 |
| 35 | Brockton | 5107 | 5,656 | 46 | 31 | 8 | 4 | 11 |
| 36 | Brockton | 5112 | 4,849 | 47 | 26 | 11 | 1 | 13 |
| 37 | Somerville | 351404 | 4,289 | 47 | 7 | 22 | 13 | 11 |
| 38 | Lynn | 2071 | 3,513 | 18 | 11 | 48 | 19 | 3 |
| 39 | Framingham | 383101 | 4,923 | 23 | 10 | 48 | 1 | 18 |
| 40 | Mission Hill | 811 | 4,091 | 48 | 21 | 15 | 13 | 2 |
Largest Cities and Towns in Greater Boston
Here are the cities and towns in Greater Boston with more than 50,000 people, based on the 2020 census.
| State capital |
| State largest city |
| Rank | Name | State | Population (2020) | Population (2010) | Change |
|---|---|---|---|---|---|
| 1. | Boston | 675,647 | 617,594 | +9.40% | |
| 2. | Worcester | 206,518 | 181,045 | +14.07% | |
| 3. | Providence | 190,934 | 178,042 | +7.24% | |
| 4. | Cambridge | 118,403 | 105,162 | +12.59% | |
| 5. | Manchester | 115,644 | 109,565 | +5.55% | |
| 6. | Lowell | 115,554 | 106,519 | +8.48% | |
| 7. | Brockton | 105,643 | 93,810 | +12.61% | |
| 8. | Quincy | 101,636 | 92,271 | +10.15% | |
| 9. | Lynn | 101,253 | 90,329 | +12.09% | |
| 10. | New Bedford | 101,079 | 95,072 | +6.32% | |
| 11. | Fall River | 94,000 | 88,857 | +5.79% | |
| 12. | Nashua | 91,322 | 86,494 | +5.58% | |
| 13. | Lawrence | 89,143 | 76,377 | +16.71% | |
| 14. | Newton | 88,923 | 85,146 | +4.44% | |
| 15. | Cranston | 82,934 | 80,387 | +3.17% | |
| 16. | Warwick | 82,823 | 82,672 | +0.18% | |
| 17. | Somerville | 81,045 | 75,754 | +6.98% | |
| 18. | Pawtucket | 75,604 | 71,148 | +6.26% | |
| 19. | Framingham | 72,362 | 68,318 | +5.92% | |
| 20. | Haverhill | 67,787 | 60,879 | +11.35% | |
| 21. | Malden | 66,263 | 59,450 | +11.46% | |
| 22. | Waltham | 65,218 | 60,632 | +7.56% | |
| 23. | Brookline | 63,191 | 58,732 | +7.59% | |
| 24. | Revere | 62,186 | 51,755 | +20.15% | |
| 25. | Plymouth | 61,217 | 56,468 | +8.41% | |
| 26. | Medford | 59,659 | 56,173 | +6.21% | |
| 27. | Taunton | 59,408 | 55,874 | +6.32% | |
| 28. | Weymouth | 57,437 | 53,743 | +6.87% | |
| 29. | Peabody | 54,481 | 51,251 | +6.30% | |
| 30. | Methuen | 53,059 | 47,255 | +12.28% |
Education in Greater Boston
Greater Boston is a very old and important center for higher education. It has many community colleges and two-year schools. It also has famous universities for both undergraduate and graduate studies. These include top schools for law, medicine, business, and technology. Greater Boston has seven "R1 Research Institutions." These are universities that do a lot of research. This is the highest number of such schools in any single metropolitan area in the United States.
Economy and Major Companies
Greater Boston has a strong economy. Many important companies have their main offices or large operations here. These companies are involved in many different industries.
Major Companies in Greater Boston
|
Getting Around Greater Boston: Transportation
Greater Boston has many ways to get around, from major highways to public transit and airports.
Major Highways and Routes
 I‑90
I‑90 I‑93
I‑93 I‑95
I‑95 I‑190
I‑190 I‑195
I‑195 I‑290
I‑290 I-293
I-293 I-295
I-295 I-395
I-395 I‑495
I‑495 US 1
US 1 US 3
US 3 US 6
US 6 US 20
US 20 US 44
US 44 Route 1A
 Route 2
 Route 2A
 Route 3
 Route 3A
 Route 4
 Route 9
 Route 16
 Route 18
 Route 24
 Route 25
 Route 27
 Route 28
 Route 30
 Route 38
 Route 53
 Route 58
 Route 60
 Route 62
 Route 97
 Route 106
 Route 109
 Route 110
 Route 113
 Route 114
 Route 115
 Route 117
 Route 122
 Route 123
 Route 125
 Route 126
 Route 128
 Route 129
 Route 133
 Route 135
 Route 138
 Route 139
 Route 140
 Route 146
 Route 213
 Route 225
Bridges and Tunnels
- Boston University Bridge, carrying Route 2
- Callahan Tunnel, carrying Route 1A Northbound
- Charles M. Braga Jr. Memorial Bridge, carrying Interstate 195
- Claiborne Pell Newport Bridge, carrying Route 138
- Fore River Bridge, carrying Massachusetts Route 3A
- Harvard Bridge, carrying Route 2A
- Longfellow Bridge, carrying Massachusetts Route 3, US Route 3, and the MBTA Red Line
- North Washington Street Bridge, carrying Route 99
- Sumner Tunnel, carrying Route 1A Southbound
- Ted Williams Tunnel, carrying I-90
- Thomas P. O'Neill Jr. Tunnel, carrying I-93 and Routes 1 and 3 concurrently
- Tobin Bridge, carrying Route 1
- Zakim Bunker Hill Bridge, carrying Interstate 93, Route 1 and Route 3 concurrently
Airports Serving the Region
- Logan International Airport in Boston is New England's largest airport.
- Manchester–Boston Regional Airport in Manchester, New Hampshire
- T. F. Green Airport in Warwick, Rhode Island
- Hanscom Field in Bedford
- Norwood Memorial Airport
- Worcester Regional Airport
- Beverly Regional Airport
- Lawrence Municipal Airport
Train and Bus Services
- The Massachusetts Bay Transportation Authority (MBTA), also known as the "T," has subway and light rail lines:
- Red Line (heavy rail): Connects Cambridge to Braintree and Boston.
- Orange Line (heavy rail): Connects Boston to Malden.
- Blue Line (heavy rail): Connects Boston to Revere.
- Green Line (light rail/streetcar): Connects Medford to Brighton, Brookline, and Newton.
- Ashmont–Mattapan High-Speed Line (streetcar): Connects Ashmont to Mattapan.
- Silver Line (bus rapid transit): Connects South Station to Logan Airport and Downtown.
- The MBTA Commuter Rail connects Boston to many surrounding towns and cities.
- Amtrak provides train service to other major cities like New York City and Chicago.
- The Downeaster train goes from Boston to Maine.
- Massport Logan Express offers bus service to Logan Airport.
- Plymouth & Brockton Street Railway Co. provides bus services.
The first railway line in the United States was built in Quincy, near the Neponset River.
Several local bus services connect with MBTA commuter rail stations:
- Brockton Area Transit Authority
- Cape Ann Transportation Authority
- Greater Attleboro Taunton Regional Transit Authority
- Lowell Regional Transit Authority
- Merrimack Valley Regional Transit Authority
- MetroWest Regional Transit Authority
- Montachusett Regional Transit Authority
- Rhode Island Public Transit Authority
- Worcester Regional Transit Authority
Ocean Transportation
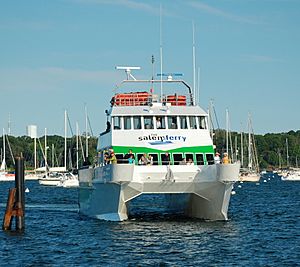
- The Port of Boston is a major shipping hub.
- The Cape Cod Canal is an important waterway.
Sports in Greater Boston
Greater Boston is home to many professional sports teams.
| Club | Sport | League | Stadium | Established | League titles |
|---|---|---|---|---|---|
| Boston Bruins | Ice hockey | National Hockey League | TD Garden (Boston) | 1924 | 6 Stanley Cups 7 Eastern Conference Titles |
| Boston Celtics | Basketball | National Basketball Association | TD Garden (Boston) | 1946 | 18 NBA Championships 23 Eastern Conference Titles |
| Boston Red Sox | Baseball | Major League Baseball | Fenway Park (Boston) | 1901 | 9 MLB World Series Championships 14 American League Pennants |
| New England Patriots | Football | National Football League | Gillette Stadium (Foxboro) | 1960 | 6 Super Bowl Championships 11 AFC Championships |
| New England Revolution | Soccer | Major League Soccer | Gillette Stadium (Foxboro) | 1996 | 1 US Open Cup 1 Supporters' Shield |
| New England Free Jacks | Rugby union | Major League Rugby | Veterans Memorial Stadium (Quincy) | 2018 | 1 MLR Championship |
Annual Sporting Events
- The Boston Marathon is a famous race that goes from Hopkinton to Boston.
- The Head of the Charles Regatta is a large rowing race on the Charles River.
- Auto races like the Lenox Industrial Tools 301 are held at the New Hampshire Motor Speedway.
The Greater Boston League is a sports conference for high schools in Massachusetts.
Images for kids
See also
 In Spanish: Gran Boston para niños
 | William M. Jackson |
 | Juan E. Gilbert |
 | Neil deGrasse Tyson |


